Linear Equation Graph Template
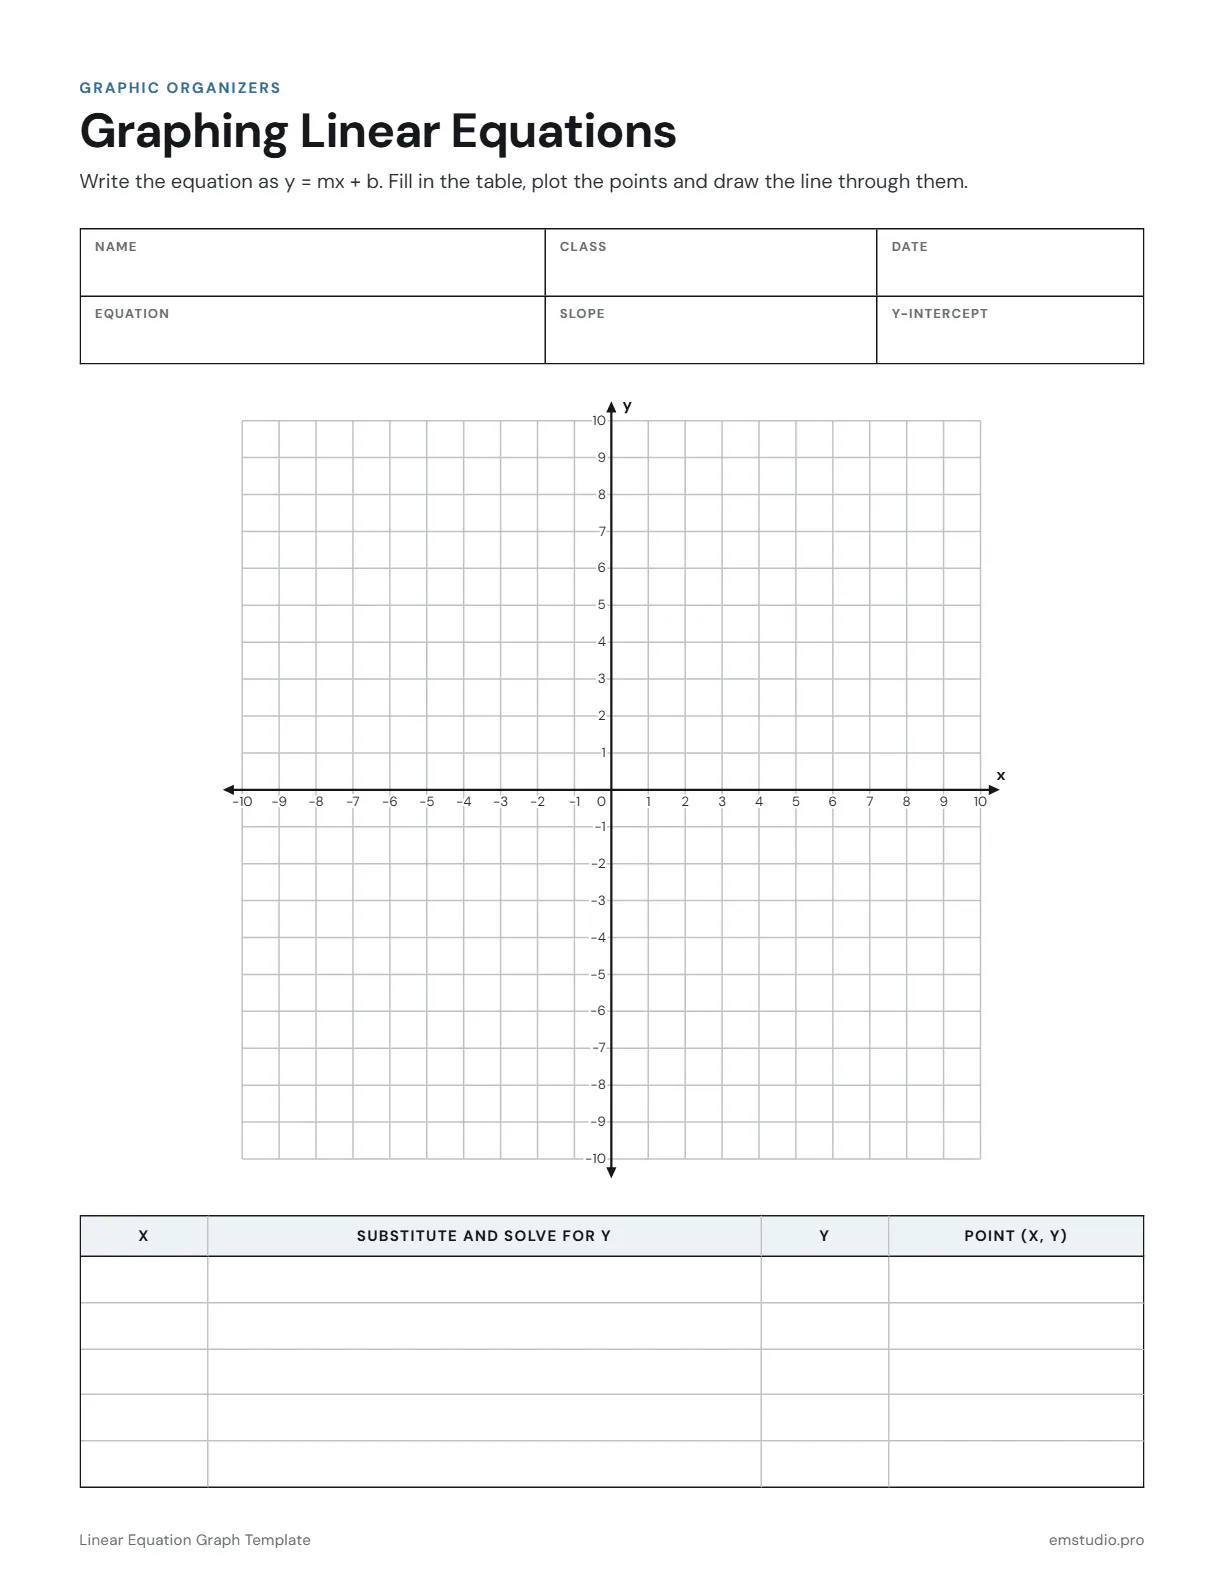
This linear equation graph template walks students through graphing y = mx + b. It has fields for the equation, slope and y-intercept, a coordinate plane from -10 to 10, and a table of values for the substitution at each x.
- Grade Level
- Grades 6 to 12
- Pages
- 1
- Formats
- PDF, Google Docs, Word
- Paper Size
- US Letter and A4
- Checked By
- Milo, Classroom Teacher
- Last Updated
- October 2026
Linear Equation Graph Template Example
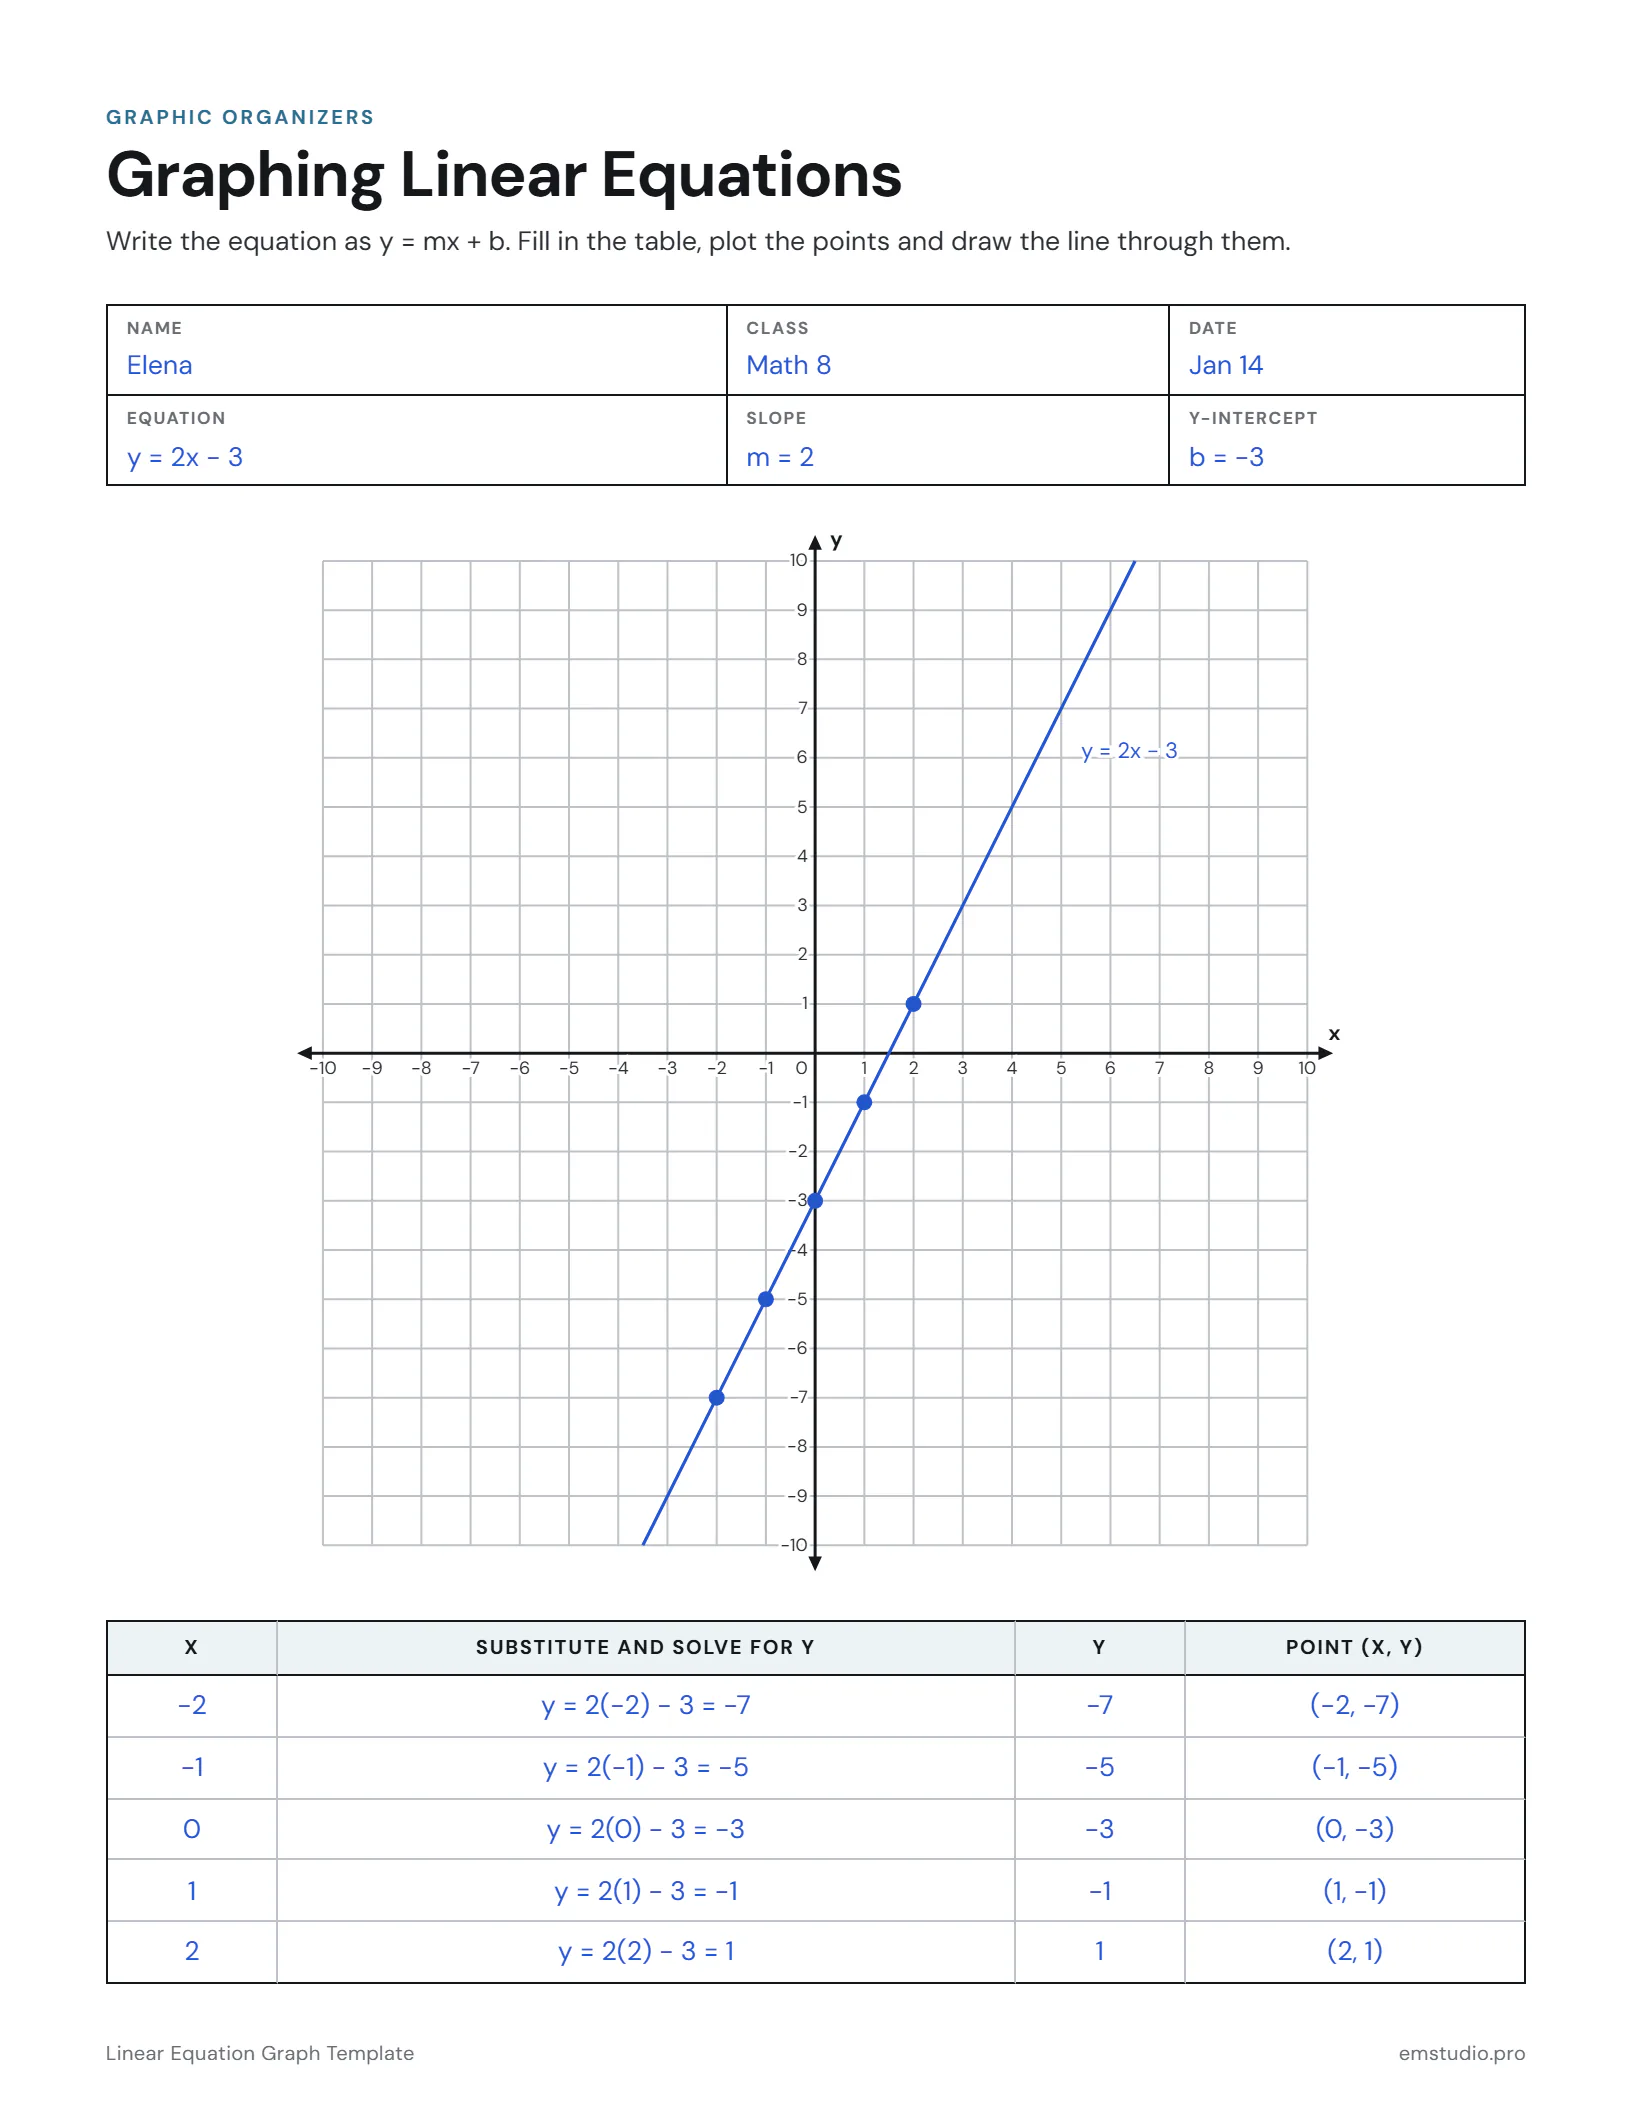
An 8th grader graphs y = 2x − 3 from a table of values.
What's in the Linear Equation Graph Template
Equation, Slope, Y-Intercept
Three fields to write the equation in y = mx + b form and name its parts.
A Coordinate Plane
A labeled grid with both axes running from -10 to 10, for plotting and drawing the line.
A Table of Values
Columns for x, the work to solve for y, y, and the point (x, y).
Word, Google Docs and PDF
Edit it in Word or Google Docs, or print the PDF. US Letter and A4.
How to Use the Linear Equation Graph
Write the Equation
Students write the equation in y = mx + b form in the Equation field, rearranging it first if needed.
Name the Slope and Intercept
They read off m and b from the equation and write them in the Slope and Y-Intercept fields.
Fill In the Table
Students pick x values, show the substitution in the second column, solve for y, and write each point.
Plot the Points
Each point from the table goes on the coordinate plane. Check that the first one is on the y-axis.
Draw the Line
Students draw a straight line through the points with a ruler and check that every point sits on it.
Linear Equation Graph Questions
More Graphic Organizer Templates
All 21 Graphic Organizer Templates
Other Templates
Plan the Lesson Around It in EMStudio
Attach any organizer to the lesson it belongs to and reuse it next year. Free to start.
Get Started for Free