Reading Fluency Chart
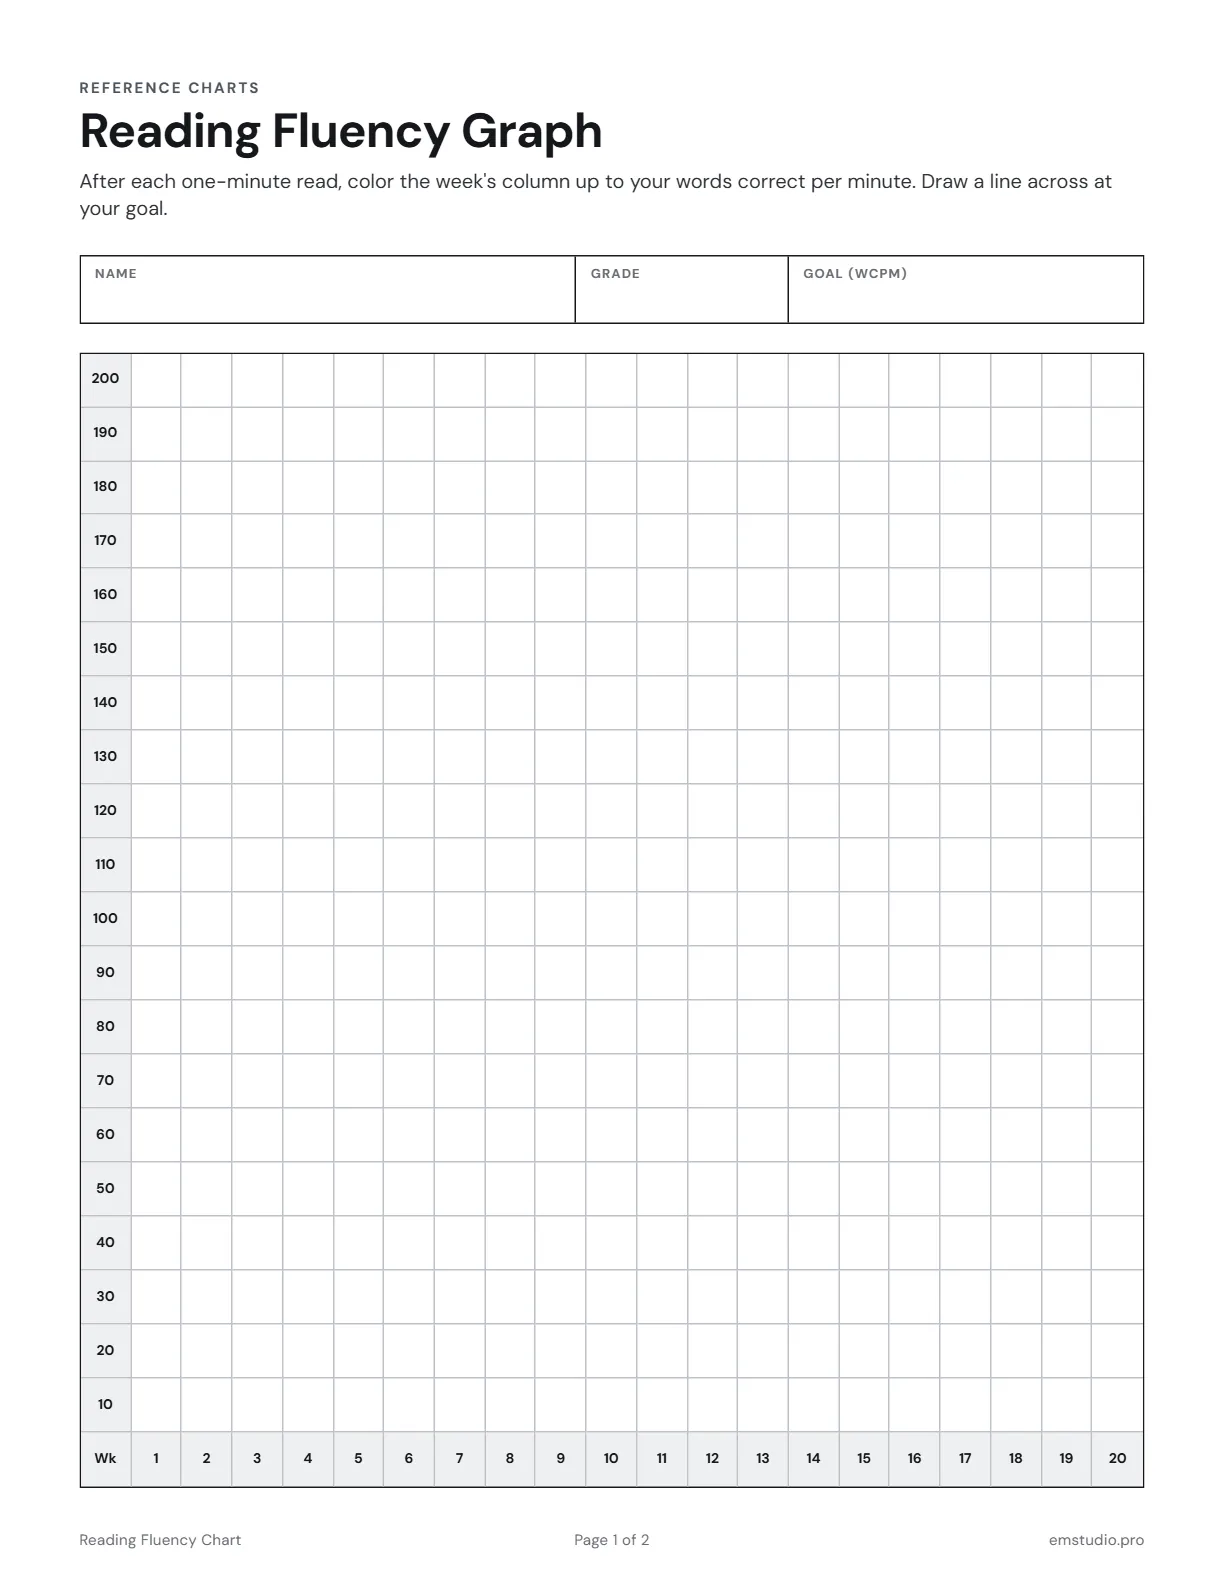
This reading fluency chart is a graph of words correct per minute, from 10 up to 200, with 20 weekly columns that a student colors in. Page 2 is a Fluency Check Record for the date, passage, words read, errors, WCPM and accuracy.
- Grade Level
- K to Grade 8
- Pages
- 2
- Formats
- PDF, Google Docs, Word
- Paper Size
- US Letter and A4
- Checked By
- Milo, Classroom Teacher
- Last Updated
- October 2026
Reading Fluency Chart Example
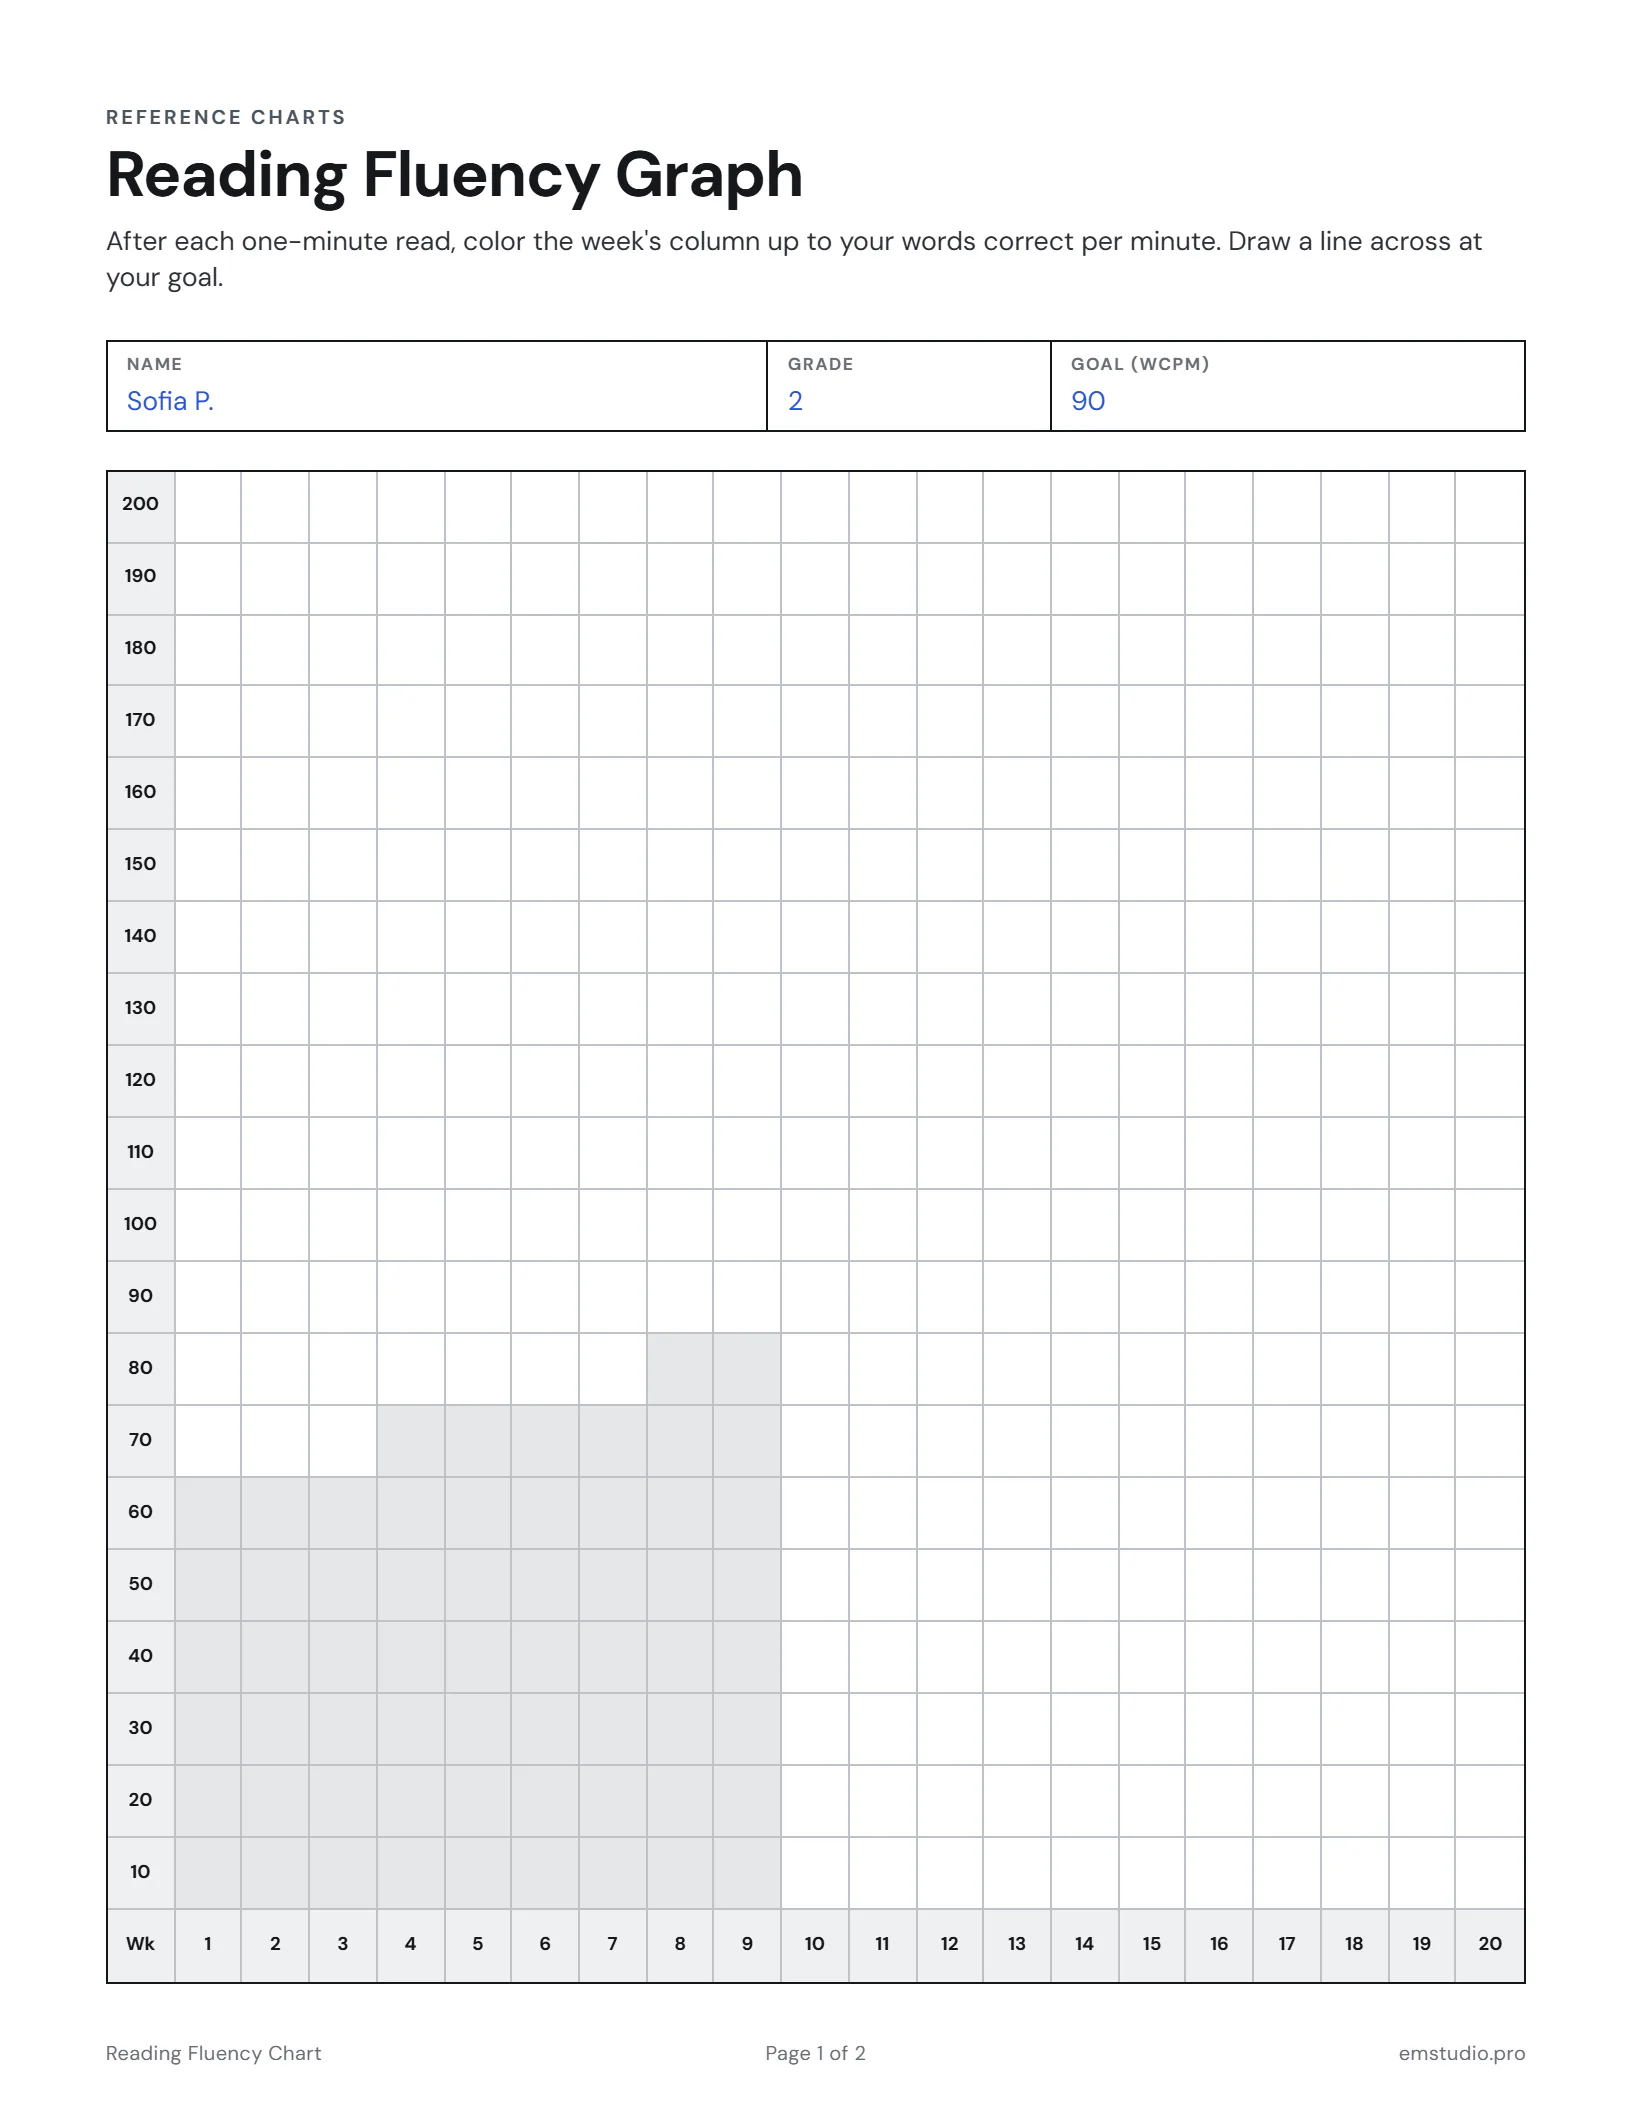
Nine weeks of one-minute reads, one bar a week: the climb from 62 to 85 words correct per minute is easy to see.
What's in the Reading Fluency Chart
A 20-Week Graph
Twenty weekly columns, with words correct per minute marked from 10 to 200 up the side.
A Goal Line
Students draw a line across the graph at their goal, with name, grade and goal fields at the top.
Fluency Check Record
Page 2 logs date, passage, words read, errors, WCPM and accuracy for each one-minute read.
Editable Versions
Edit the Word or Google Docs file before you print, or type straight into the PDF.
How to Use the Reading Fluency Chart
Fill In the Top of the Graph
Have the student write their name and grade, and set a goal in words correct per minute together.
Draw the Goal Line
Find the goal number up the side and have the student draw a line straight across the graph.
Time a One-Minute Read
Give the student a new passage, time one minute, and count the words read and the errors.
Work Out WCPM
Subtract the errors from the words read on page 2. The answer is the words correct per minute.
Color the Week's Column
Have the student color that week's column up to the WCPM score and watch the bars climb toward the line.
Reading Fluency Chart Questions
More Reference Charts for Teachers
All 13 Reference Charts for Teachers
Other Templates
Plan the Lessons Behind the Chart in EMStudio
Lesson plans, standards and grades in one app built by a teacher. Free to start.
Get Started for Free