Grading Scores Explained, Including GPA and Letters

Jump to section
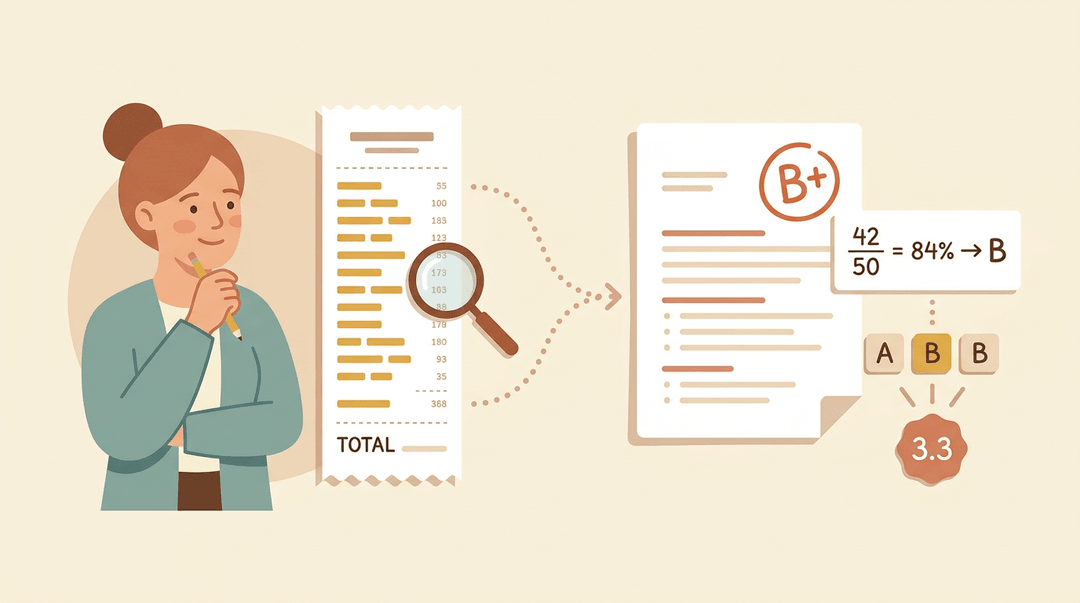
Think about a receipt that shows only a total. You'd want to see how that number got there. Grades work the same way.
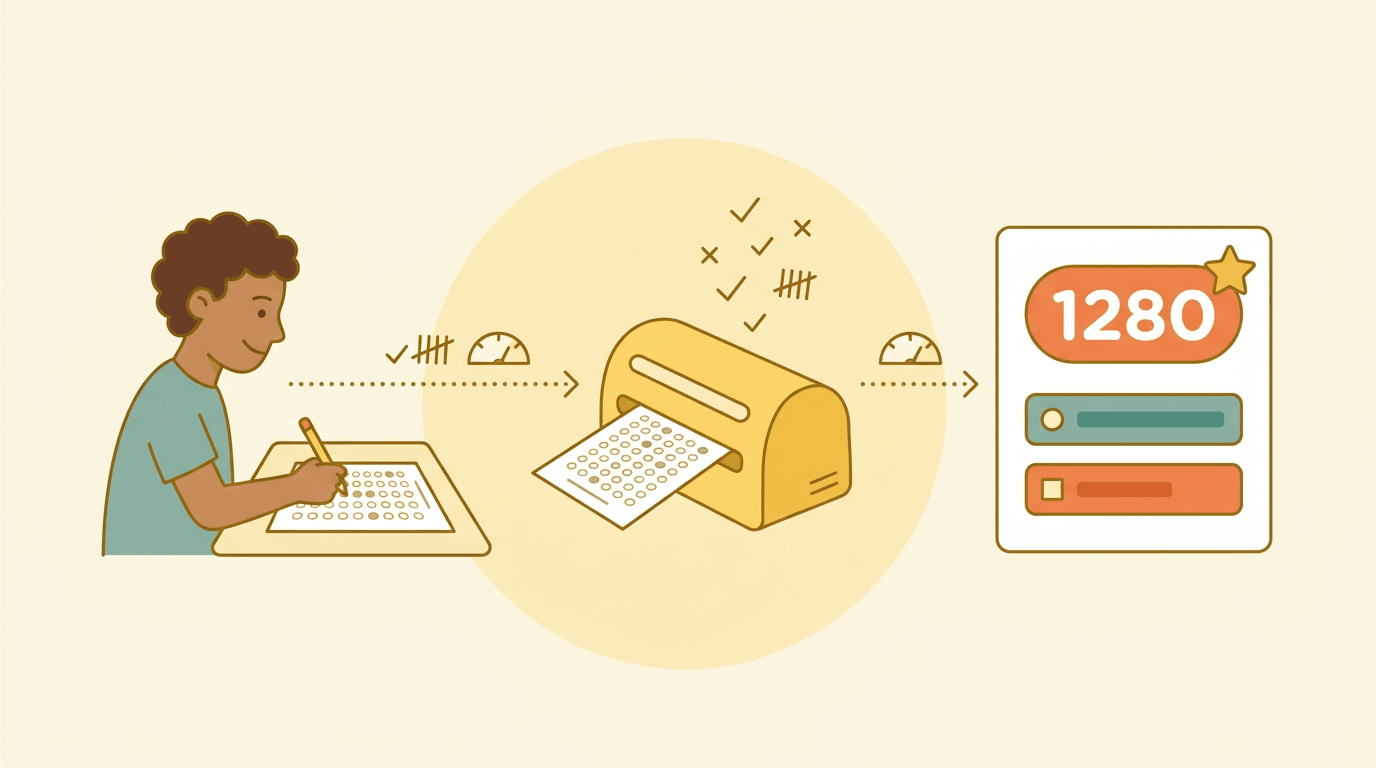
Grading scores are the points, percentages, and letters that show how a student performed. Most come from a simple formula: earned points divided by possible points, matched to a letter on your scale.
Add grade point average (GPA) and those letters roll into one number.
We'll walk through each step, from calculating a score to building a fair, consistent workflow.
How to Calculate Grading Scores
Here's how to move from raw scores to a finished grade, with a few shortcuts along the way.
Enter your numbers step by step
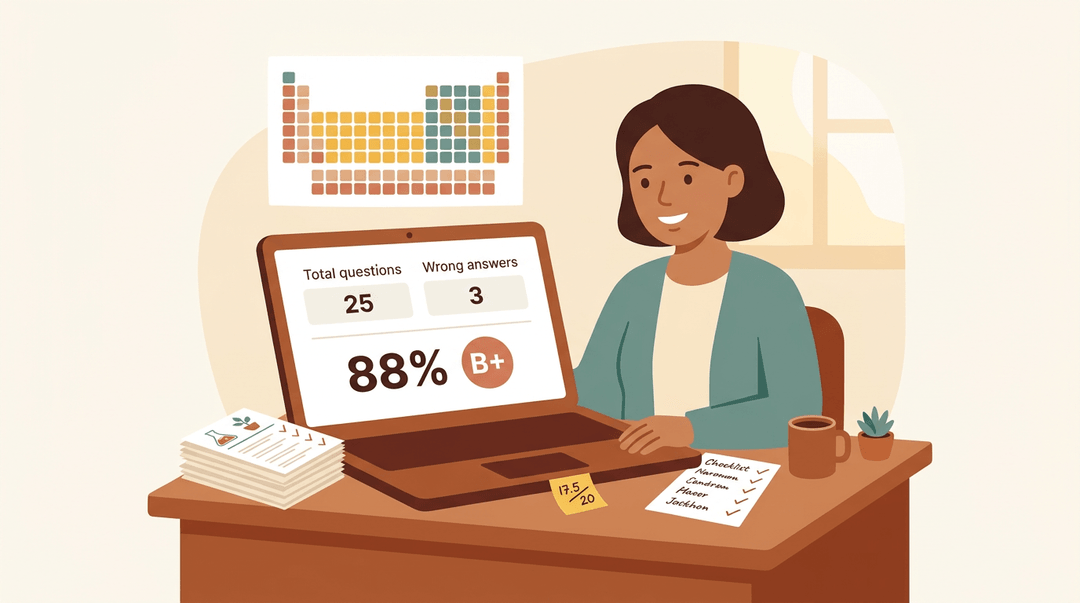
Start with the basics. Enter the total questions, then the wrong answers. Your percentage and letter grade appear instantly.
Think of a seventh-grade science teacher grading a 25-question quiz. She enters 25 once, then each student's wrong-answer count, and has every result in minutes.
Half-point credit? Decimals work too: a score of 17.5 out of 20 calculates like any whole number.
Use the basic percentage formula
Want to check the math yourself? Use two steps:
- Divide the number correct by the total.
- Multiply by 100.
Worked example: 18 of 20 gives 18 ÷ 20 = 0.90, and 0.90 × 100 = 90%.
To convert a percentage to points, multiply the percentage (as a decimal) by the total points. An 85% on a 40-point assignment is 0.85 × 40 = 34 points.
Two pitfalls matter most. Round only at the end, since early rounding can shift a grade. Never drop a missing assignment, because skipping a zero inflates the average. Zeros count.
Averaging weighted assignments and coursework
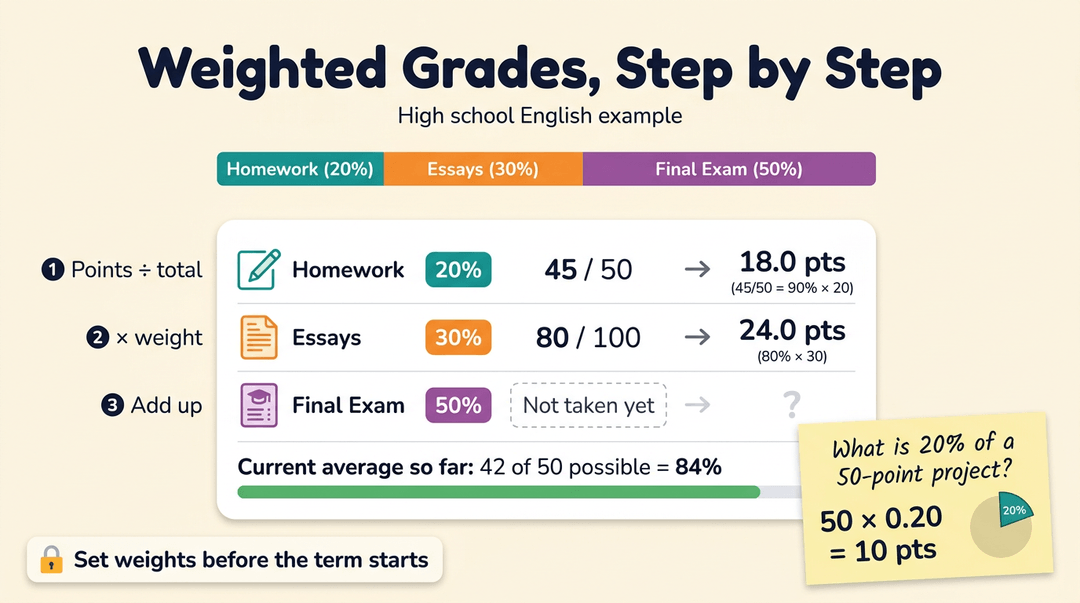
Some grades blend many pieces. Consider a high school English teacher whose grade mixes homework, essays, and a final exam, each with its own weight.
- Enter grades with weights. Type each category's points beside its weight.
- Current average so far. See where a student stands mid-term.
- Points earned over total points. Divide points earned by points possible within each category, then apply its weight.
- Set category weights before term. Decide them up front so you grade consistently instead of adjusting after the fact.
How much is 20% of a grade? Multiply the total points by 0.20. On a 50-point project, that's 10 points.
Quick charts for looking up grades
Sometimes you only need a lookup. A wrong-answer chart lists every wrong-answer count alongside its percentage for one test size. Score tables by test size cover common lengths, and a printable chart sits beside your stack of papers.
Finally, a grade distribution chart shows how a class's scores spread, so a cluster of low scores can point to the test itself.
How Grading Scales Turn Numbers into Letters
Every grade starts as a number, and the scale you use decides which letter it becomes. Here's how the common systems work.
How US letter grades usually break down
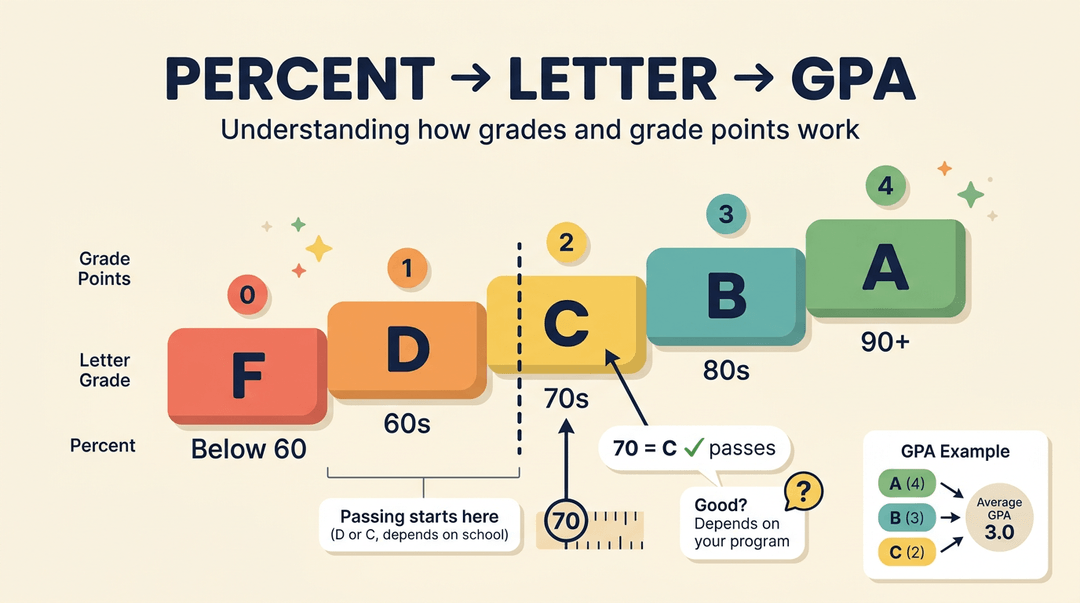
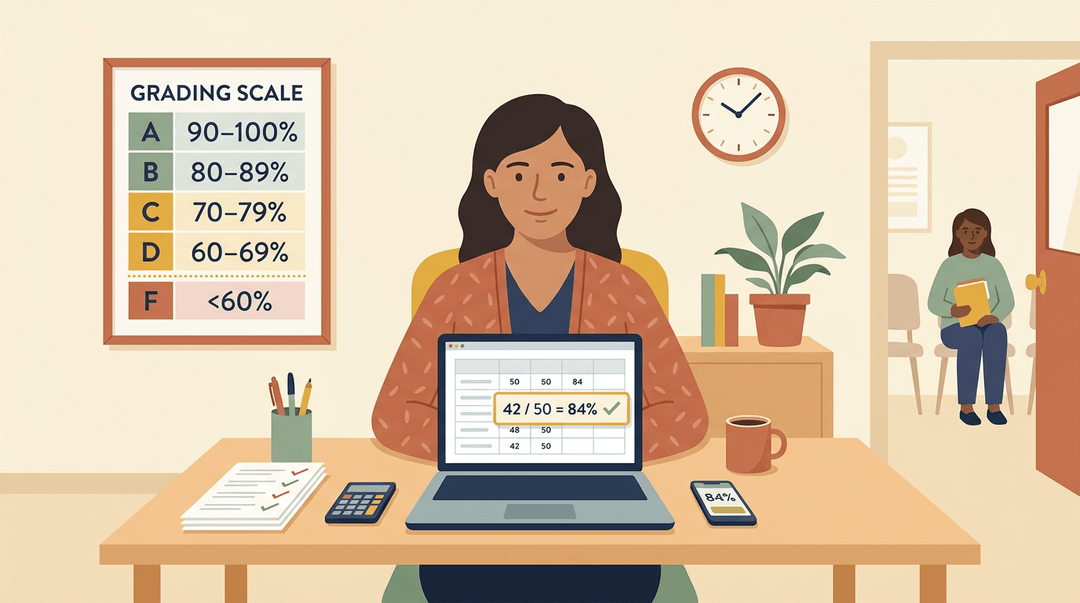
Most schools in the United States use these ranges:
- A: 90 and up
- B: the 80s
- C: the 70s
- D: the 60s
- F: below 60
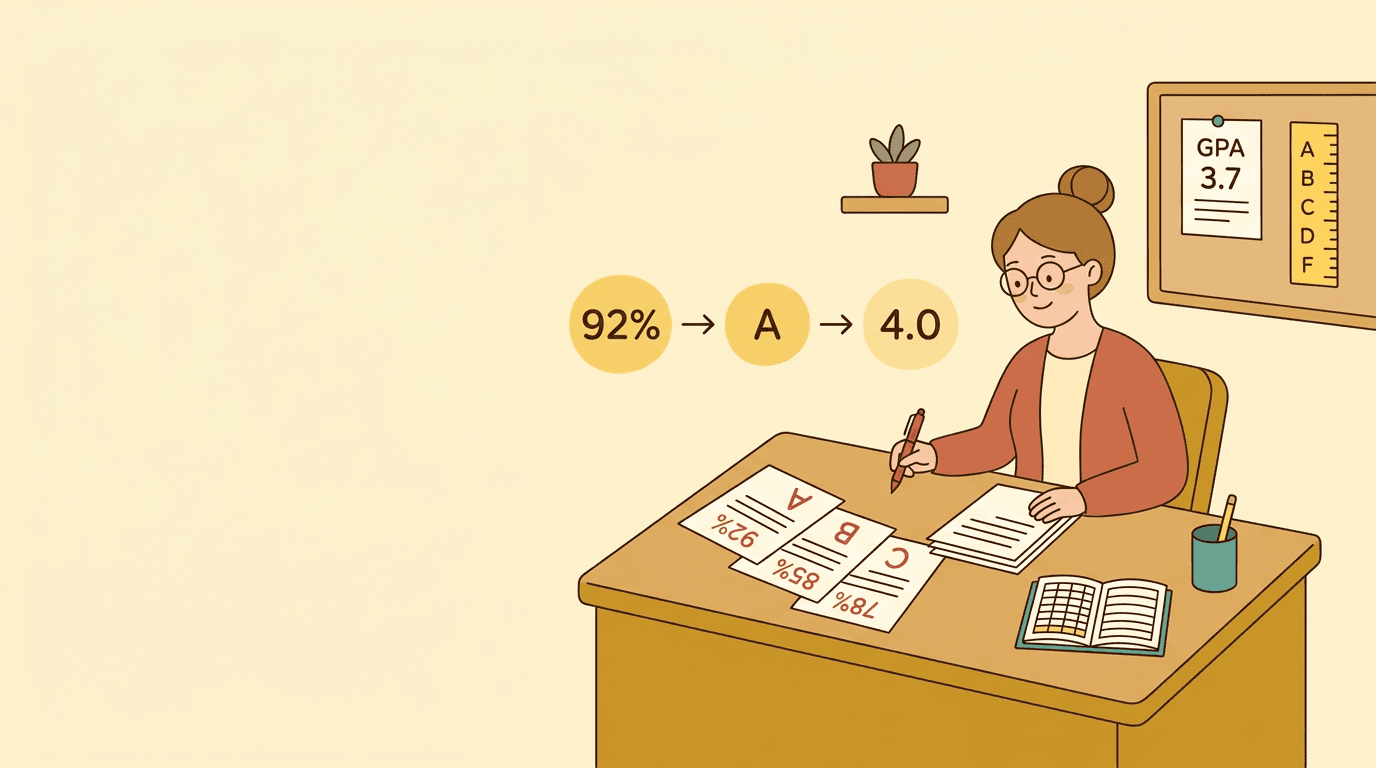
Each letter carries a grade-point value, and a grade point average (GPA) averages those values across a student's courses. Converting a percentage is a simple lookup: find the range, then read its value.
Passing starts at D or C, depending on the school. So is 70 a good grade in college? A 70 is a C, which passes under either standard. Passing, yes. Good? That depends on the program and what the student needs it for.
What is a 3.7 GPA on a 4 scale?
On a 4.0 scale, a 3.7 is typically an A-, and a 3.3 is a B+. Most calculators list grades from A+ to D-, with plus and minus marks shifting values by a few tenths.
Some also offer a 5-point or 12-point toggle, so confirm which scale your school reports. The scale comes first.
How plus and minus cutoffs are set
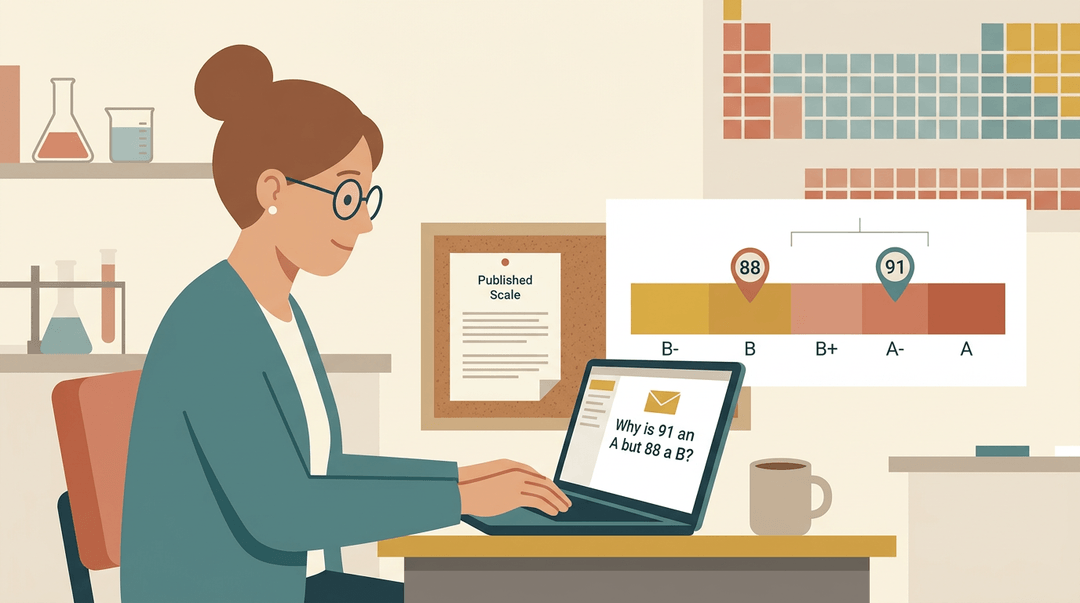
A high school chemistry teacher gets a parent email asking why a 91 became an A but an 88 became a B. She points to the published cutoffs and settles it in one reply.
Cutoffs often sit at midpoints between ranges, and many schools fold A+ into A. Since cutoffs follow those midpoints, a plus or minus band can cover a wider slice of points than its neighbor, so range widths aren't always equal.
GPAs are usually rounded to the nearest hundredth, so 3.666 becomes 3.67.
Why grading differs between schools and countries
Passing marks vary by country. In the United Kingdom (UK), University College London's regulations for remote online exams use a 40% pass mark.
Germany uses a 1.0 to 5.0 scale, where the University of Hamburg's grade converter notes that 1.0 is best and 4.0 is a bare pass.
A score that passes in one place can fail in another, so check school policy first.
Some schools skip letters altogether. With standards-based grading, you report each learning standard, measuring mastery of a skill rather than an average of points. Mastery scores show whether a student has reached a skill level.
Turning Raw Scores into Fair Grades
Use this guide when you need to turn a pile of points into letter grades or GPA values that you can explain to any student or parent. Set it up once, then run the same steps every grading period.
Set up your system
- Choose your scale and cutoffs.
- Example: A = 90 to 100, B = 80 to 89, C = 70 to 79, D = 60 to 69, F = below 60.
- Set your category weights.
- Example: tests 50%, quizzes 20%, homework 20%, participation 10%.
- Weights must add up to 100%.
- Publish the policy to students.
- Put the scale and weights in your syllabus and gradebook.
- Walk through one sample calculation on day one.
Convert every score the same way
Consistency is what makes a grade fair. Run each score through the same three moves.
- Turn points into a percentage.
- Points earned ÷ points possible × 100, so 43 of 50 is 86%.
- Match the percentage to your cutoffs.
- 86% falls in the 80 to 89 range, so it's a B.
- Apply one rounding rule, always.
- Say: "We round to the nearest whole percent, only at the final step."
💡 Tip: Decide your rounding rule before the term starts. Deciding at 89.5% with a parent watching is how fairness slips.
See it at three grade levels
The math stays the same; the shape of the score changes.
| Level | System | What it looks like |
|---|---|---|
| Elementary | 4-level proficiency | 4 Exceeds, 3 Meets, 2 Approaching, 1 Beginning |
| Middle school | Percentage categories | Category averages × weights, summed to a percentage |
| High school | Weighted GPA | Letter converts to points (B = 3.0 on a 4.0 scale) |
For high school, check whether your school adds a point for honors or AP courses. Follow that policy exactly.
Example: A middle school teacher has tests at 88%, quizzes at 80%, homework at 95%, and participation at 100%. Weighted, that's 44 + 16 + 19 + 10 = 89%. Under the rounding rule, 89% stays a B, and the teacher can show the student exactly where the missing point came from.
Before you post grades
Run these checks every time. Each one confirms the grades are ready.
- Totals checked twice. Recompute at least one student by hand and confirm the weights still sum to 100%.
- Outliers reviewed. Look at zeros and sudden drops; a missing assignment is not the same as a failed one.
- Feedback shared with scores. Add a one-line comment so the number comes with a next step.
Track weighted scores and automatic grade calculations in EMStudio's online gradebook.
What Calculators Offer and Who Uses Them
A grading calculator is a tool for checking a score, not for keeping a gradebook. It's quick, free, and useful when you need an answer in seconds.
Handy features built into the tool
Here's what you'll usually find:
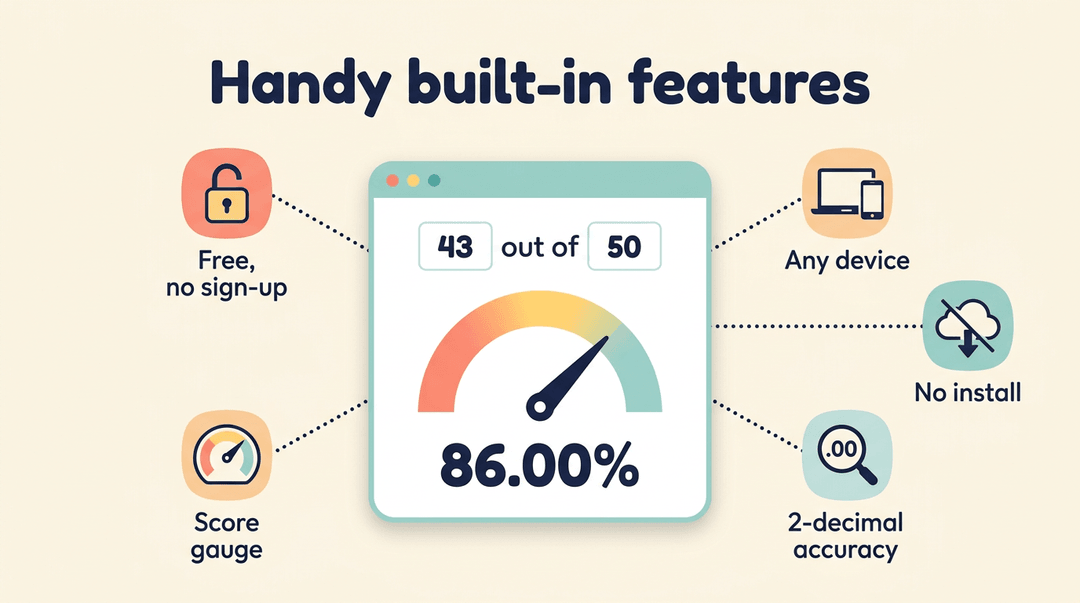
- Free, no sign-up. Open it and start entering numbers without creating an account.
- Works on any device. Use it on a laptop at your desk or a phone during lunch duty.
- No installation needed. There's nothing to download, so it's ready as soon as the page loads.
- Two-decimal accuracy. Scores are shown to two decimal places, so 43 out of 50 appears as 86.00%.
- Score gauge visual. A dial-style display shows where a score falls at a glance.
Teachers, students, and parents who use it
Teachers often reach for a calculator when grading quizzes.
Consider a seventh-grade science teacher who finishes a 20-question quiz stack at 9 p.m. Instead of re-adding every column by hand, she enters each total, confirms it, and moves on to tomorrow's lab.
Students use the same tool to check their own scores. A student who earns 38 out of 45 on a unit test can confirm the percentage (84.44%) before the next class.
Parents use it to track progress, too. A parent comparing percentages across several quizzes can see whether a child's scores are climbing or slipping, instead of guessing from a single grade.
The real payoff is time. Hand-checking every total eats minutes that add up across five classes. A calculator gives those minutes back. Less arithmetic, more feedback.

Other Calculators That Pair with This One
A few companion calculators can answer the bigger questions once you know how a single score becomes a grade.
Work out a weighted class average
Not every assignment should count the same. A weighted average lets each category carry the share of the grade you've assigned it.
- Weighted assignments and exams. Let the final exam count for more than a weekly worksheet.
- Percentage, letter, and point inputs. Enter scores in whatever format you already have.
Picture a middle school science teacher whose lab reports count for a large share of the grade. The true course average appears in seconds.
What you need on your final exam
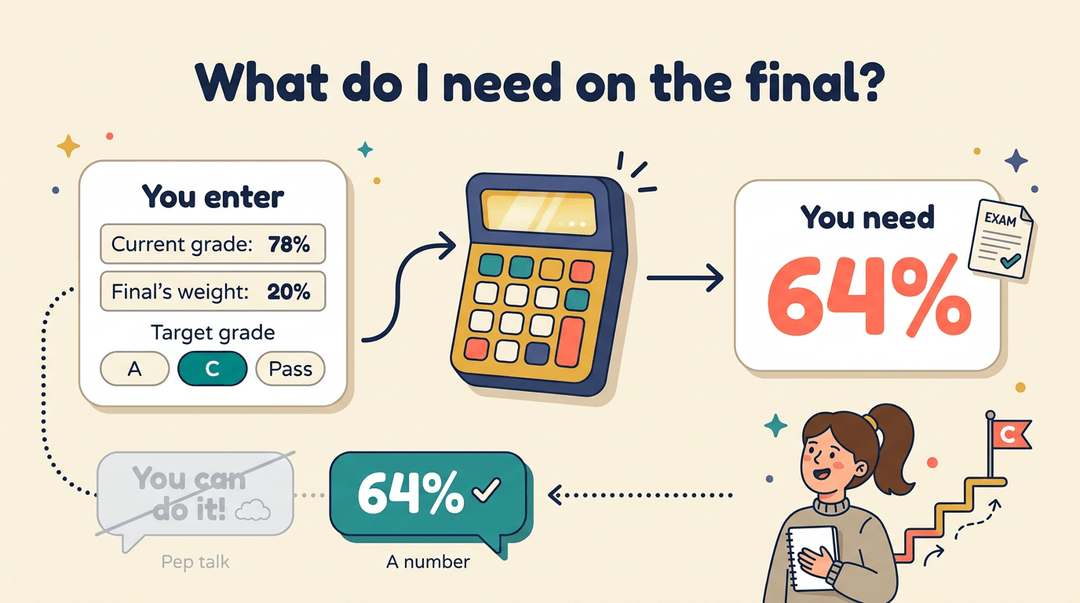
Ever wonder what a student needs on the final to reach a goal? Enter the current grade and the final's weight, then choose a target grade: an A, a C, or simply a pass. The calculator returns the exact score needed on the exam.
A student who asks what she needs to earn a C gets a number instead of a pep talk, and that number makes the goal feel reachable.
Combine course grades into a GPA
A GPA (grade point average) averages the grades from several courses into one number on a 4.0 scale. Enter each course's letter grade, and the calculator returns a cumulative GPA.
A single test score shows how one assessment went. A GPA shows how a student is doing across many courses over time. One test is a snapshot. The GPA is the full portrait.
Background and Common Questions
Before you calculate anything, we'll look at where grading tools came from and the questions teachers ask most. You'll also see grade point average (GPA) on transcripts, and in GPA the g simply stands for grade.
How grading tools developed over time
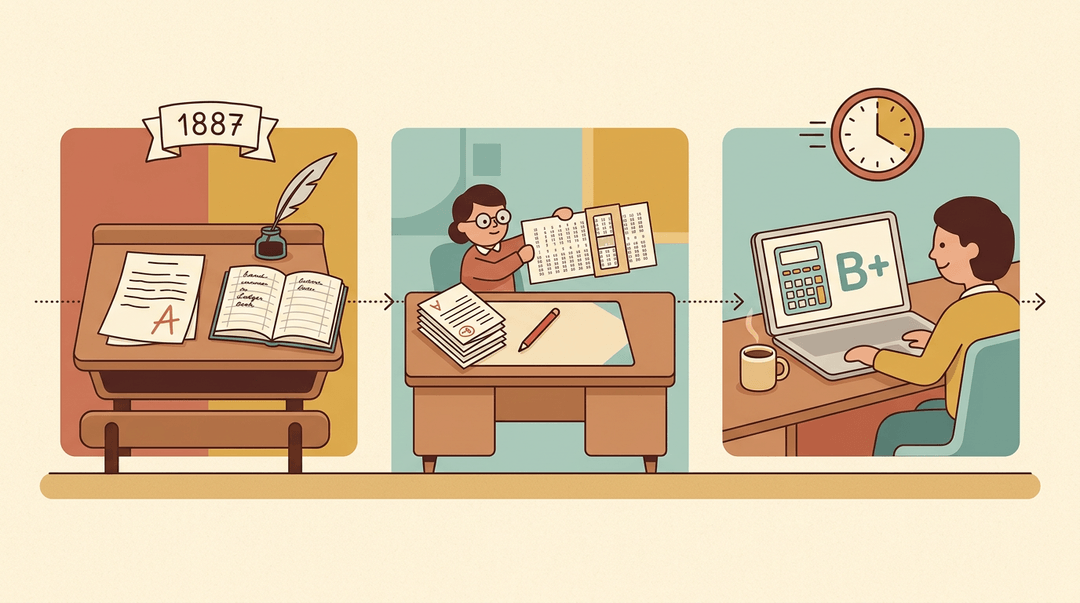
Mount Holyoke introduced letter grades in 1887. Later, many teachers relied on the EZ Grader, a physical slide chart for turning points into a grade.
Online calculators eventually replaced those charts, so the math hasn't changed nearly as much as how quickly you can do it.
Answers to common questions
A passing score is the lowest grade that counts as passing, and your school or district sets it. Check that policy first.
Some classrooms use percentages, point totals, or proficiency levels such as 'meeting standard' instead of letters. Use whichever option your school allows.
To find a current grade, divide the points earned by the points possible, then multiply by 100. Consider a seventh-grade math teacher preparing for a parent conference.
Instead of redoing the arithmetic by hand, she enters the points, and the grade appears in seconds. She walks in with an exact answer.
Whether an app exists depends on the tool, so check if your calculator or gradebook has a phone version before you download anything.
Each school or district sets its own cutoffs, which is why an 89 might be a B+ in one building and a plain B in another. Check your local scale before comparing grades across schools.
Grades make more sense when every step is visible. Once you know how a score is calculated, how it maps to a letter, and how it feeds into GPA, you can explain any mark with confidence.
A steady routine keeps it fair: use the same formula every time, check your scale before you grade, and keep every score in one place.
Ready to make grading faster? Check out our Grading & Assessment page to record scores with automatic calculation in a digital gradebook.
References
- Regulations for Remote Online Exams | Student and Registry Services - UCL — ucl.ac.uk (2026)
- Grade Converter : UHH : University of Hamburg — uni-hamburg.de
Frequently asked questions
What is a grading chart?
A grading chart is a table that matches scores, percentages, or numbers of incorrect answers to grades. A grade distribution chart instead shows how scores are spread across a class.
What is grading in elementary school?
Grading in elementary school is how teachers report students’ progress and learning. It may use percentages or letters, but many elementary schools use proficiency levels such as 4 for exceeds expectations, 3 for meets, 2 for approaching, and 1 for beginning.
What is a 3.7 GPA on a 4 scale?
A 3.7 GPA on a 4.0 scale is typically equivalent to an A−. Exact grade-point values can vary by school, so check the institution’s scale.
What is a C out of 20?
A C out of 20 depends on the grading scale. If a C is 70% to 79%, it corresponds to 14 to just under 16 points out of 20; school cutoffs may differ.
How much is 20% of a grade?
Twenty percent of a grade is one-fifth of the total. Multiply the total points by 0.20, so 20% of a 50-point assignment is 10 points.
How to convert percentage to points?
To convert a percentage to points, write the percentage as a decimal and multiply it by the total possible points. For example, 85% of a 40-point assignment is 0.85 × 40 = 34 points.
What does grading method average grade mean?
The average-grade method means adding the grades and dividing by the number of grades to find their arithmetic mean. If assignments have different weights, use a weighted average instead, applying each grade’s assigned share.
Is 70 a good grade in college?
A 70 is generally a C and counts as passing under many college grading scales. Whether it is considered good depends on the course, program requirements, and the student’s goals.