PSAT Grading Explained: How Answers Become Scores


Jump to section
Opening a PSAT (Preliminary SAT) score report can feel like reading a weather forecast in a language you never learned. There are numbers everywhere, and it's not always clear which ones matter most.
The good news is that PSAT grading follows a clear path, and once you see the steps, the report starts to make sense.
In this post, we'll cover how answers become scores, how to read a report, how National Merit qualifying works, and how to turn results into a study plan students can use.

PSAT Grading Basics and What It Measures
Before you can make sense of a PSAT score report, it helps to know what the test is and what it's for. PSAT stands for Preliminary SAT, and the PSAT/NMSQT adds the National Merit Scholarship Qualifying Test to its name.
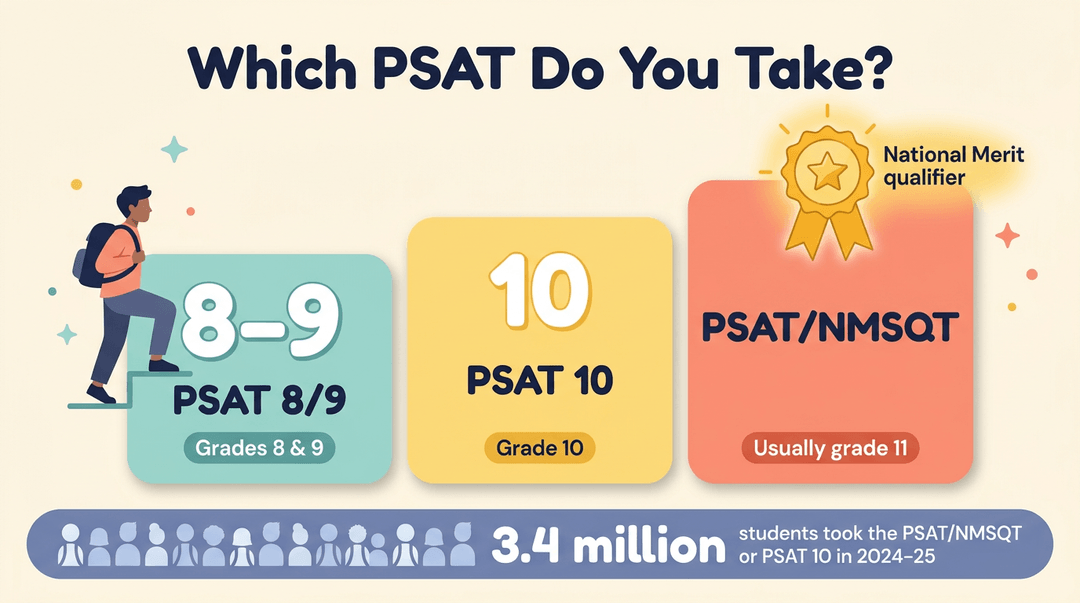
Which PSAT version you take
There are three versions. The PSAT 8/9 and PSAT 10 are named for the grades they target, and the PSAT/NMSQT also serves as a National Merit qualifying test.
According to College Board, approximately 3.4 million students participated in the PSAT/NMSQT or PSAT 10 in the 2024-25 school year.
Why take the PSAT and what it tests
The PSAT measures math, reading, and writing skills, and it gives students SAT practice so the format feels familiar. It's also a useful college readiness gauge.
Consider a 10th grade math teacher who scans a class's results and spots the students who are on track and the ones who need support now. Those early signals give that teacher time to adjust before the next unit.
Because the PSAT is a low-stakes diagnostic, it's less about scoring and more about guiding what happens next.
How the PSAT fits into admissions
Here's the part worth sharing with students and families: the PSAT isn't part of the college application. Colleges don't see these scores, so there's no admissions pressure riding on them.
It's a snapshot, not a verdict. Treat it as practice, not pressure.

How PSAT Answers Become Scores
Every PSAT score starts with a simple count, then gets translated onto a scale built to hold steady across test versions. Here's how each step works, so you can explain any score report with confidence.
Turning correct answers into scaled scores
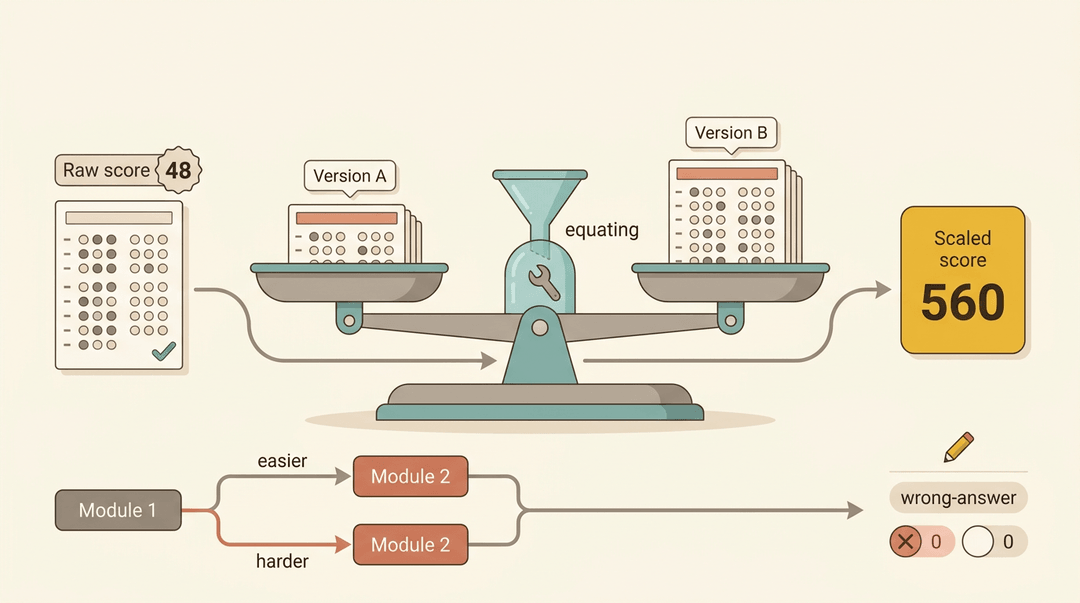
Questions are multiple choice and computer-scanned. The starting point is the raw score: the number of correct answers. But one version may be a bit harder than another, so a raw score alone can't be compared directly.
That's where equating comes in. It adjusts for difficulty differences so the scaled score reflects ability, not which version a student took.
The digital PSAT is adaptive too: the second module depends on how a student did in the first, and equating helps keep those paths comparable.
Wrong answers don't subtract points, so there's no penalty for guessing. A blank gains nothing.
The range of total and section scores
Total scores run from 320 to 1520. Math and Reading and Writing each run from 160 to 760, and the total is the sum of the two section scores. That's slightly different from the SAT's range, which we'll compare below.
Test scores, cross-test scores and subscores
Test scores fall between 8 and 38 and feed the section math below. Cross-test scores measure skills that apply across subjects. Subscores range from 1 to 15 and point to specific skill areas.
Section scores show how much a student earned, while subscores show where their strengths and gaps lie.
How to calculate your section scores
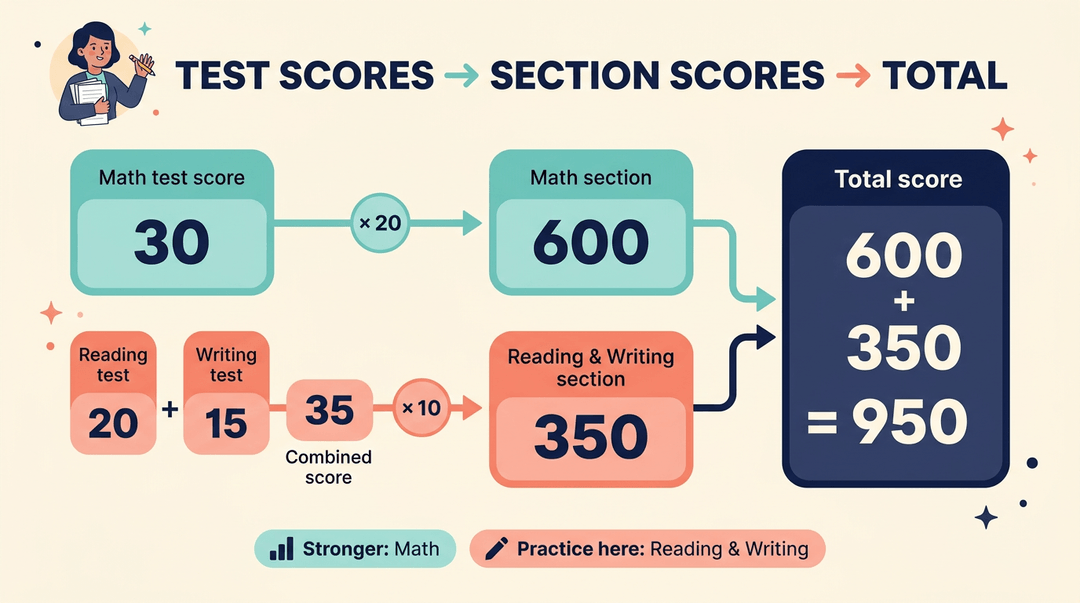
Two formulas turn test scores into section scores:
- Math section score: Math test score × 20
- Reading and Writing section score: combined Reading and Writing test scores × 10
Picture a junior-year math teacher with a stack of score reports. One student sees a Math test score of 30 and asks what it adds up to, so she works it out on the page:
- Math: 30 × 20 = 600.
- Reading and Writing: test scores of 20 and 15 combine to 35, and 35 × 10 = 350.
- Total: 600 + 350 = 950.
The student leaves with a total they understand and a clear focus: math is the stronger section, and Reading and Writing is where practice can go.
How PSAT and SAT scales compare
The SAT runs from 400 to 1600, while the PSAT tops out at 1520, so a perfect PSAT isn't a perfect SAT.
The PSAT is designed as a practice version of the SAT: a preview of its format and skills, not a substitute for the real thing. Treat it as a rehearsal, not a verdict.
Making Sense of Your Score Report
Score reports are packed with numbers, so start with the ones that show where your student stands. Each one answers a different question.
What your percentile ranking means
A percentile compares you to your peers, meaning the other students who took the same test. It's the percent of test-takers who scored at or below your score. A student at the 99th percentile scored at or above 99 percent of the group.
A student at the 50th percentile landed right in the middle, with about half the group scoring higher. A percentile measures where you stand among peers, not what you know in absolute terms.
Consider a 10th grade teacher who has students find their percentile before they look at the total. The talk shifts from 'Is this bad?' to 'Where do I stand, and what's my next move?'

Is a 1440 on the PSAT 10 good?
A 1440 on the PSAT 10 sits well above the average, which hovers around 900 to 930. Scores follow a bell-curve distribution: most students cluster near the middle, with fewer at the extremes.
A 1060 is also above that average, which makes it a solid score to build on. Whether a score is good depends on grade and goals. For juniors, a 1200 or higher is strong.
Checking your college readiness benchmarks
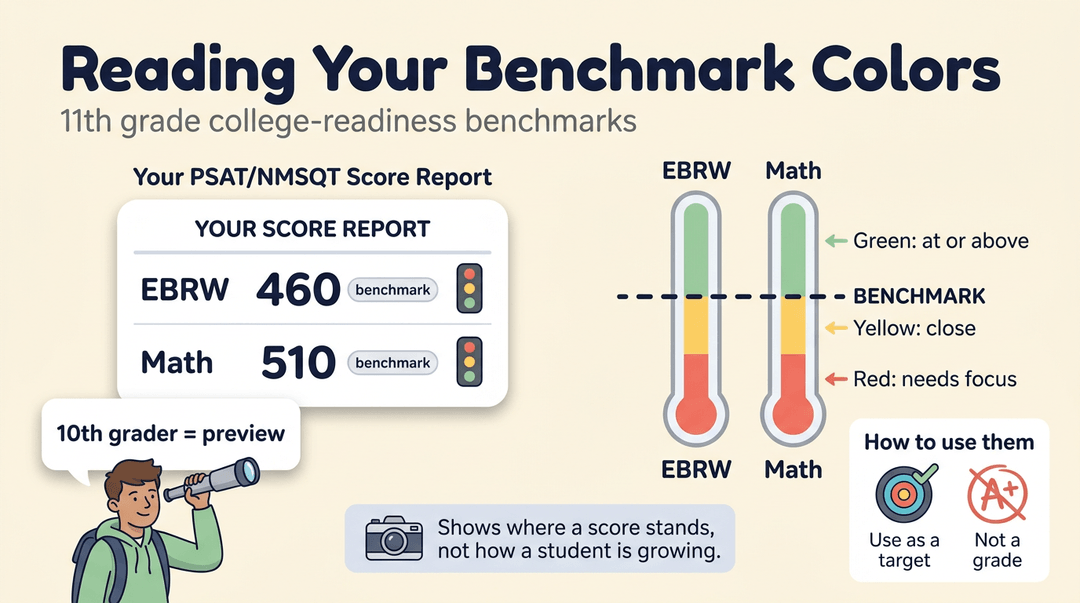
The College Board's sample score report lists the 11th grade college-readiness benchmarks:
- EBRW (Evidence-Based Reading and Writing): 460
- Math: 510
Your report color-codes each section green, yellow, or red for a quick read. These are 11th grade benchmarks, so a 10th grader sees a preview. Benchmarks show where a score stands, not how a student is growing. Use them as a target, not a grade.
Walk Students Through Their PSAT Score Reports
This is a 30-minute playbook for turning a score report into one concrete study goal per student. Run the lesson, adjust your talking points by grade, then keep a simple log so growth shows up on paper.
The 30-minute lesson
Students need a job to do with the report, or they'll glance at the total and shut the folder. Give them a pen and these four steps.
- Hand out score reports (about 3 minutes)
- Say: "Look for a minute. Notice your first reaction, then set it aside."
- Locate total and section scores (about 7 minutes)
- Students circle the total score and each section score.
- Find lowest subscores (about 10 minutes)
- Students underline their one or two lowest subscores.
- Partners compare: "Which lowest subscore surprised you?"
- Set one study goal (about 10 minutes)
- Write it on the report: "I'll practice [lowest subscore] for 15 minutes, three times a week."
One goal beats five. A student with a single, specific target will actually start.
Example: A 10th-grade teacher has students tape the marked-up report inside their planner. Two weeks later she asks, "Show me your goal and what you've done on it." Every student has something to point to, and the report stays in use.
What each grade should focus on
The same report means different things depending on how far off junior year is.
| Grade | Focus | Your framing |
|---|---|---|
| 9th | Baseline, no pressure | "This is your starting line." |
| 10th | Practice for junior year | "Here's what to build before next fall." |
| 11th | National Merit index check | "Let's see where you stand." |
Talking through scores
Before students leave, confirm you've covered each of these.
- Percentile vs. score: The score is points; the percentile is how they compare with other test takers.
- Benchmarks: Show where each student sits against the benchmarks on the report.
- Normalized disappointment: Tell students one result is a snapshot, not a verdict.
- SAT practice schedule: Each student leaves with days and times written down.
⚠️ Watch out: Don't skip the percentile explanation. Students often read a percentile as a percent correct, and a good result can feel like a failure.
Tracking practice scores over time
A goal needs a scoreboard. Have students (or you) keep a running log, with the PSAT as row one.
| Date | Practice test | Score | Change from baseline |
|---|---|---|---|
| Report date | PSAT (baseline) | Total score | None |
| Month 1 | First practice test | Total score | Score minus baseline |
Then follow a monthly rhythm:
- Log every practice test the day it's scored.
- Compare against baseline, not against classmates.
- Review growth each month in a two-minute check-in.
Seeing the change column move up is often the best motivation a student gets.
Log practice-test scores and track each student's growth over time in the EMStudio online gradebook.
How to Qualify for National Merit
Qualifying comes down to three moving parts: a calculated score, a state-by-state cutoff, and a few key dates. Let's walk through each one so you can explain it clearly to students and families.
How your Selection Index is calculated
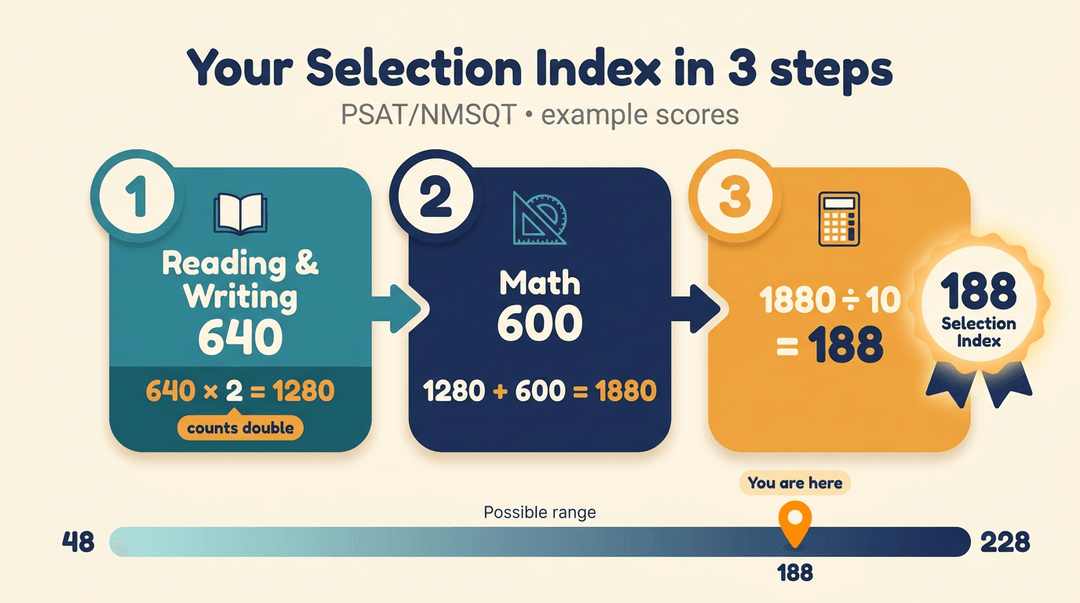
Your Selection Index is the number that matters, and it comes from your PSAT/NMSQT (the Preliminary SAT and National Merit Scholarship Qualifying Test). The formula is simpler than it looks:
- Double your Reading and Writing total.
- Add your Math total.
- Divide that sum by 10.
The result falls between 48 and 228, and eligibility is determined by this index, so every section you take counts toward your standing.
Think of an 11th-grade counselor who sits down with each junior once score reports arrive and works the index out by hand.
Students who sit close to their state's line get a plan aimed at a few more points, while everyone walks away knowing exactly where they stand.
Where state cutoffs and commended scores fall
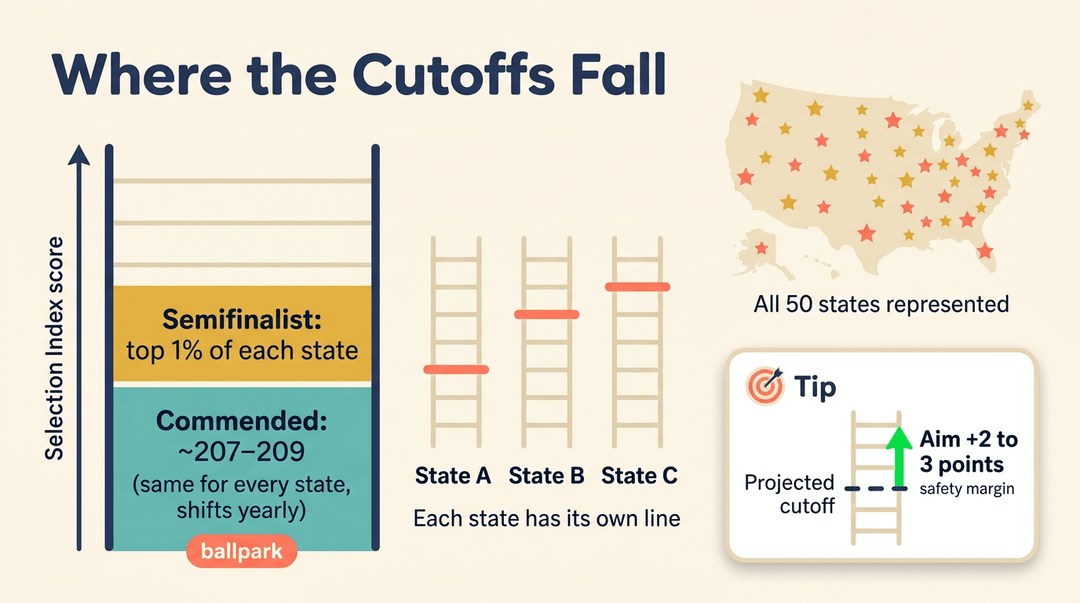
Semifinalists are the top 1% in each state, and cutoffs are set by state rather than by one national line. A University of Central Florida thesis describes them as the highest-scoring entrants in each state.
A study of Oklahoma's Academic Scholars Program adds that each state gets its own higher cutoff, which guarantees representation from all 50 states.
Commended Students fall below that line. The same University of Central Florida thesis explains that they're named on a nationally applied Selection Index score that shifts from year to year.
The commended score is around 207 to 209, but it moves each year, so treat that number as a ballpark.
Each year, look up a projected state cutoff table for your state to see where the Semifinalist line may land. Then aim for 2 to 3 points above that projection. Projections are only estimates, so those few extra points are your safety margin.
Moving on to Finalist and awards
National Merit's student guide says more than 16,000 high scorers will qualify as Semifinalists, representing less than 1% of the nation's high school graduating seniors.
Advancing from there takes a Finalist application, and the requirements are spelled out in National Merit's materials, so don't skip the details.
About 95% of those Semifinalists, over 15,000 students, are expected to become Finalists and receive a Certificate of Merit that attests to their distinguished performance.
About 7,500 scholarships are awarded, and that's the prize that makes the climb worth it.
Who qualifies and when it counts
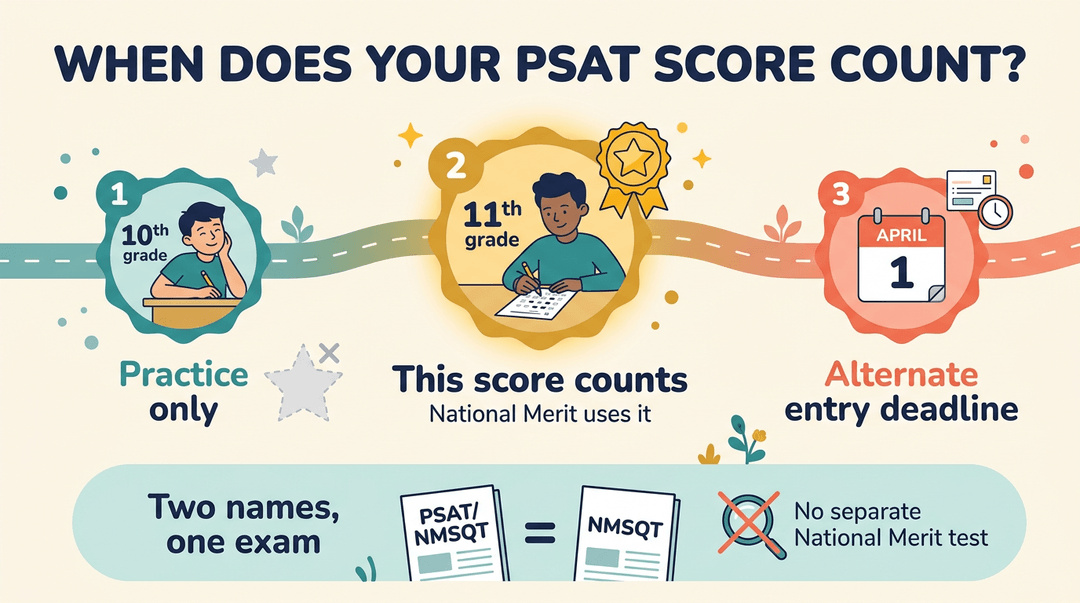
Timing decides which score counts, so keep these rules handy:
- Only 11th grade counts. Your junior-year PSAT/NMSQT is the score National Merit uses.
- 10th grade is practice. Use that sitting for practice rather than pressure.
- Alternate entry by April 1. Alternate entry is possible, but it has to happen by April 1.
Students will see both names, but the PSAT/NMSQT and the NMSQT are one exam, so there's no separate National Merit test to chase.
How high scores open scholarship doors
High scores unlock scholarships, which is where the real value shows up. National Merit recognition is worth celebrating on its own, but the scholarship is the main impact. High scores open doors, and it starts with knowing where each student stands.
Use PSAT Scores to Prepare for SAT
Your students' PSAT scores do more than rank them. They show where each student is headed and which skills need attention first.
How well the PSAT predicts SAT results
The PSAT is a useful indicator of SAT performance. The SAT Suite, which runs from the PSAT 8/9 through the SAT, uses one score scale for its total and section scores.
According to the College Board's score guide, PSAT score ranges can be used to predict a student's SAT score range.
That makes the PSAT a valuable diagnostic practice tool: it shows where students stand before SAT prep begins.

Plan your study around weak spots
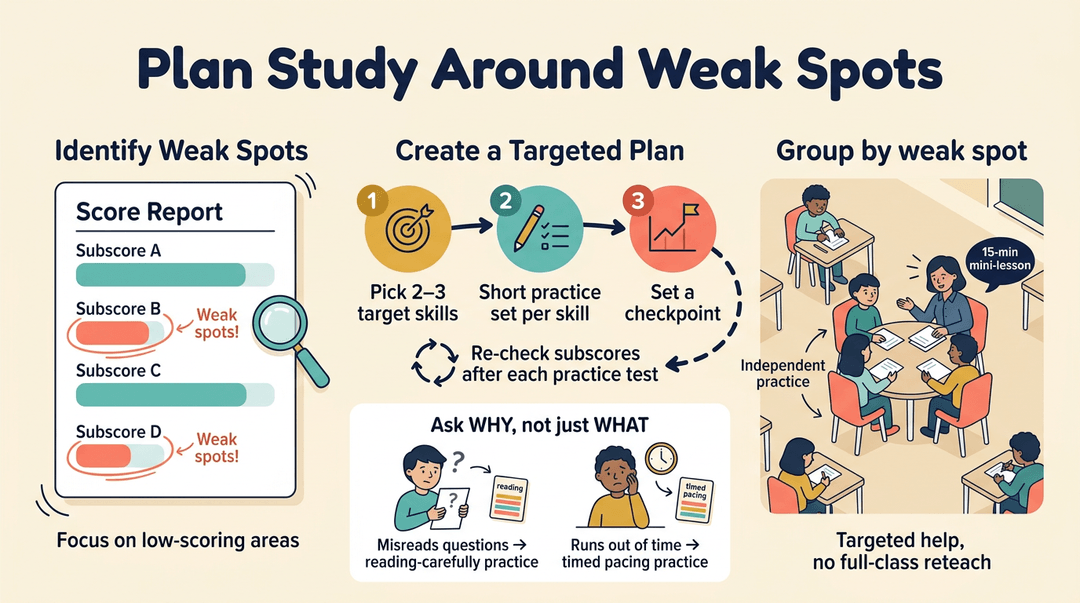
Use the detailed subscores on each report to spot strengths and weaknesses, then build each student's SAT study plan in three steps:
- Pick two or three target skills from the weak spots.
- Assign a short practice set for each skill.
- Set a checkpoint to see what's improving.
Reviewing missed questions by skill makes the plan work. It's less about what students missed and more about why. A student who misreads questions needs different practice than one who runs out of time.
Subscores guide future study too: revisit them after each practice test and adjust the target skills as needed.
Group students by subscore weakness. Consider a teacher who pulls the four students struggling with the same skill into a 15-minute mini-lesson while the rest of the class works on independent practice.
Those four get targeted help without a full-class reteach. Less guesswork, more teaching.
Privacy, Access and When Scores Are Released
Before we dig into what the numbers mean, it helps to know who can see them, when they arrive, and which choices are yours to make.
Who can see your scores
Several groups can see your results, but you control one of them. Here's who has access:
- Students and their high school: You and your school can see your scores.
- District or state access: Your district or state may also have access.
- National Merit Corporation: The National Merit Corporation can see your scores too.
- Colleges, only if shared: Colleges see your scores only if you choose to share them.
How to opt out of scholarship release
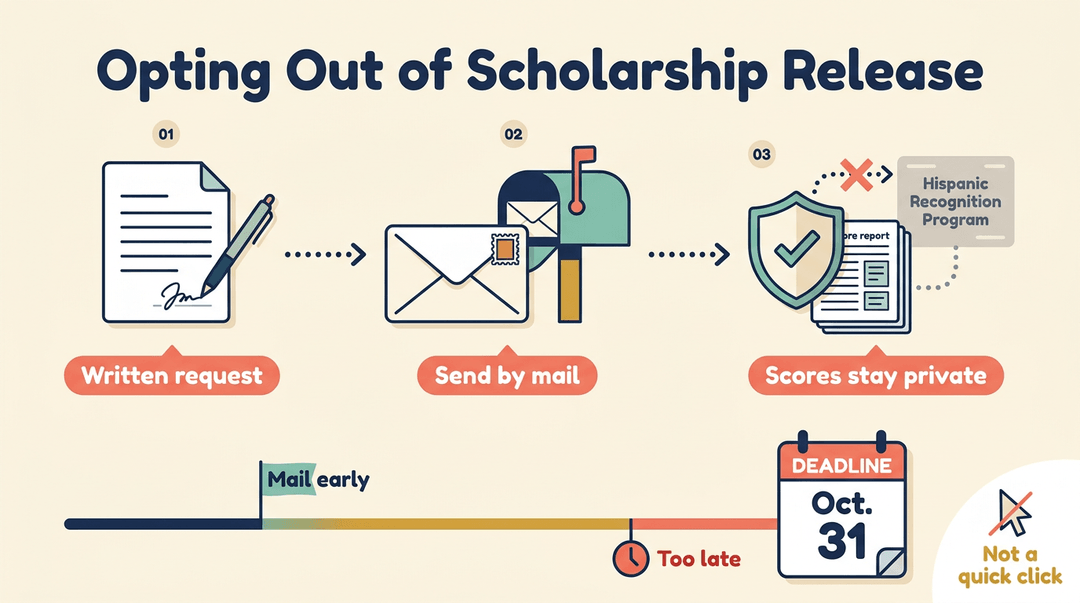
Opting out of scholarship release keeps your scores away from programs like the Hispanic Recognition Program. The deadline to opt out is Oct. 31, and the request is a written one sent by mail.
That makes it a paper task, not a quick click, so get it done early. Early beats late.
Deciding on the Student Search Service
Participating in the Student Search Service is optional, so sharing your information is a choice, not a requirement. If you don't participate, your scores aren't provided through the service.
Take a junior who isn't sure about sharing her information. Her counselor explains that the choice is optional, and she heads home to talk it over with her parents. By the time she decides, she's making the call with the full picture.
How do I check my PSAT score?
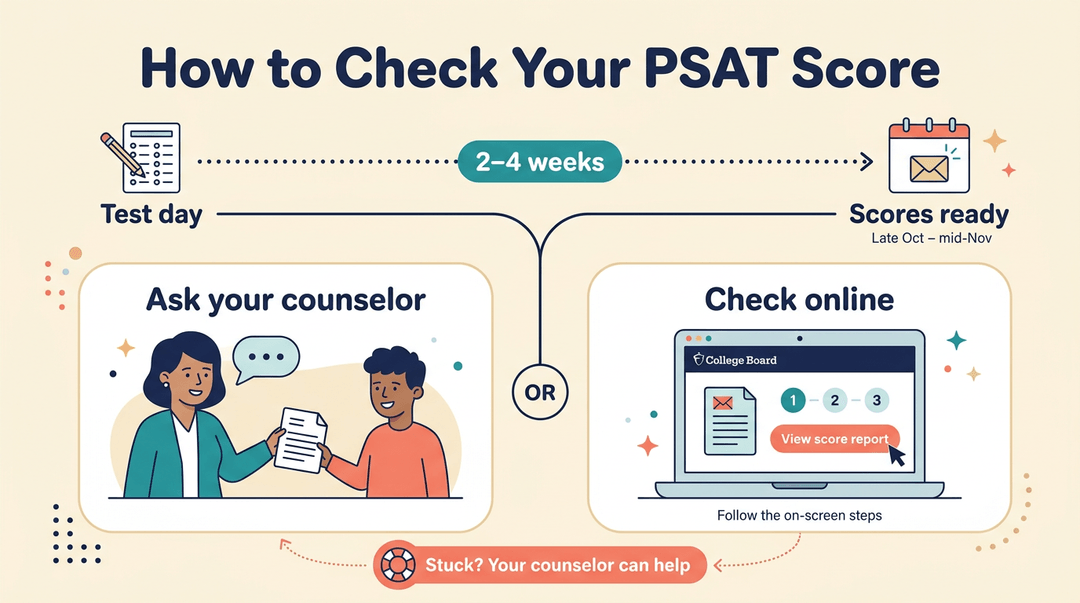
Expect your scores two to four weeks after the test, which generally puts release somewhere between late October and mid-November.
To check your PSAT score, you have two options: ask your counselor, or check online through College Board. Online, head to College Board, find your score report, and follow the on-screen steps. If you get stuck, your counselor can help you through it.
Getting Support, Tutoring and Parent Help
Nobody should decode a score report alone. Here's how we'd bring in the right help and keep students steady.
Choosing tutoring and test prep services
Some families turn to private PSAT tutoring for more one-on-one attention than class time allows.
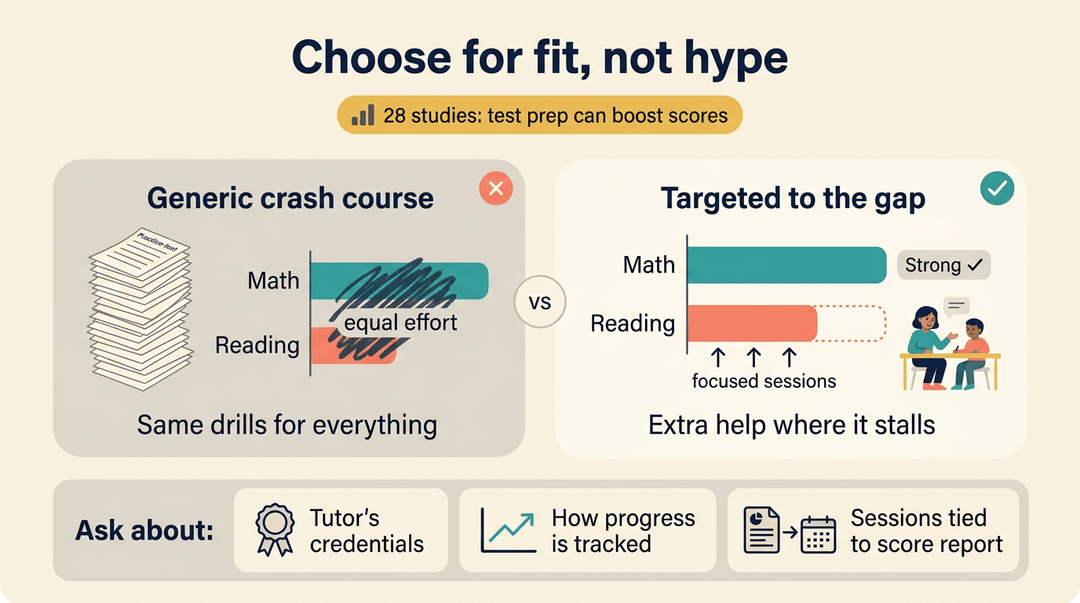
The evidence is encouraging: a 2026 meta-analysis by Zhanxin Hao, Jo-Anne Baird, Yasmine El Masri, and Kit Double of 28 studies suggested that test preparation can significantly improve students' test performance.
Choose for fit, not hype. Look for a plan built around your student's specific gaps, not a generic stack of practice tests. Ask about:
- the tutor's credentials
- how progress gets tracked
- how sessions connect to the score report
Consider a parent whose daughter is strong in math but stalls in reading. A few focused sessions with a tutor on that gap are a better investment than a broad crash course.
Helping students stay calm about scores
Help students treat the score report as a roadmap showing where they are on the way to where they're going. It's a starting point, not a final grade.
Keep the study schedule low-pressure. A few short, regular sessions beat a frantic weekend of cramming. Steady wins.
When a score disappoints, acknowledge the feeling first, then review the report together and pick one skill to work on.
Think of a sophomore who sees weak reading scores, spends one session a week on it, and by spring has a very different report to discuss.
Below-average isn't a cause for worry. One practice score is information, not a judgment on ability. Keep the conversation on next steps.
Once you understand how PSAT scores are built, the report stops being a mystery and becomes a roadmap. Use it to spot strengths, pinpoint gaps, and guide each student's next steps toward the SAT.
When students know what their numbers mean, they can take ownership of their progress.
Ready to keep your students' progress in one place? Check out Grading & Assessment to record and organize grades with automatic calculation in a digital gradebook.

References
- sample-psat-nmsqt-score-report — collegereadiness.collegeboard.org
- The Impact of Test Preparation on Performance of Large-Scale Educational Tests: A Meta-analysis of Experimental Studies - Zhanxin Hao, Jo-Anne Baird, Yasmine EI Masri, Kit Double, 2026 — journals.sagepub.com (2025)
- National Merit Finalists At The University Of Central Florida-trends, Attrition, And Retention 1997-2005 — stars.library.ucf.edu (2006)
- Awarding state merit-based financial aid programs: Evaluating Oklahoma's Academic Scholars Program — hdl.handle.net (2006)
- SAT Participation in the Class of 2025 Surpasses 2 Million Test Takers for the First Time Since 2020 — newsroom.collegeboard.org (2025)
- student_guide — nationalmerit.org
- psat-nmsqt-understanding-scores — satsuite.collegeboard.org
Frequently asked questions
What is a 1060 PSAT score?
A 1060 PSAT score is above the typical average, which is around 900 to 930. Whether it is a strong score depends on your grade, goals, and section scores, so use the report to identify skills to build.
How to check PSAT score?
You can check your PSAT score online through your College Board account by opening your score report and following the prompts. You can also ask your school counselor for help accessing it.
What should the average PSAT score be?
There is no single average score that every student should aim for, and averages vary by PSAT version and grade. A typical PSAT 10 score is around 900 to 930; your grade, goals, and score report benchmarks matter more than the average alone.
What does PSAT stand for?
PSAT stands for Preliminary SAT. PSAT/NMSQT stands for Preliminary SAT/National Merit Scholarship Qualifying Test.
Is a 1440 on the PSAT 10 good?
Yes. A 1440 on the PSAT 10 is well above the typical average of about 900 to 930. The PSAT is a low-stakes practice test, so use the score report to understand strengths and areas to improve.
Is a 1200 a good SAT score?
A 1200 is a solid SAT score and is above the national average, though whether it is good for you depends on the colleges you are considering and their admitted-student score ranges. Compare it with those schools’ requirements and consider your section scores when deciding whether to retake it.
What time do PSAT scores come out?
PSAT scores usually come out two to four weeks after testing, often between late October and mid-November. Exact release dates vary by test date and year, so check College Board or ask your school counselor.