Learning Curve Meaning: The Complete Guide to How It Works

Jump to section
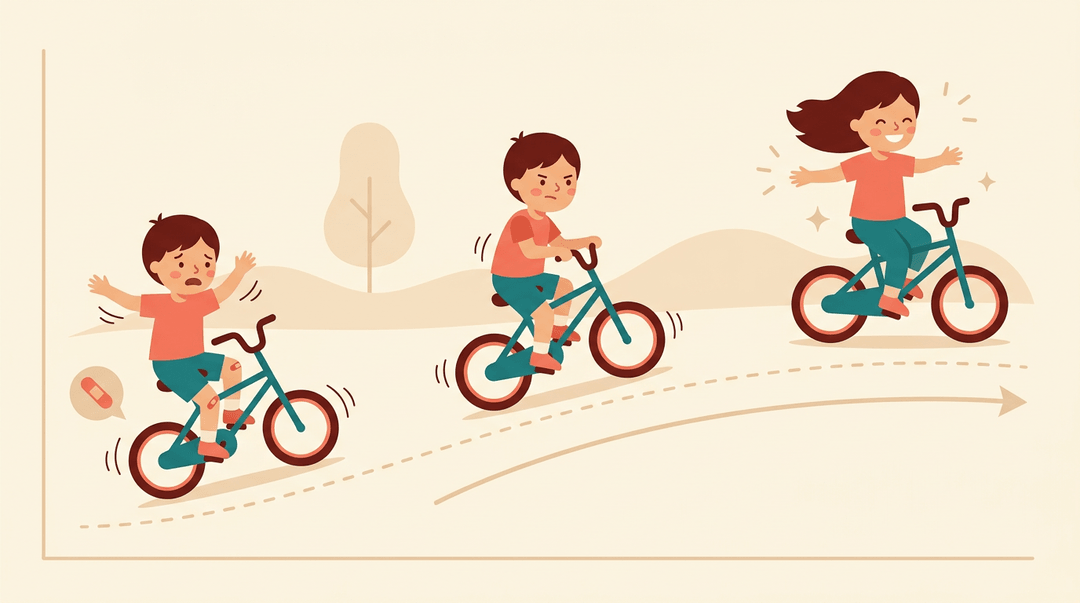
Think back to the first time you rode a bike. Wobbly starts, a few scraped knees, then suddenly it clicked and pedaling felt automatic.
That's a learning curve: the pattern of how performance improves with practice over time, usually fast at first, then slower as mastery sets in.
It shows up everywhere, from a new hire learning a job to a student learning long division. Below, we'll unpack its real meaning, the math behind it, where the phrase came from, and why "steep" doesn't mean what most people think.
What the Learning Curve Actually Means
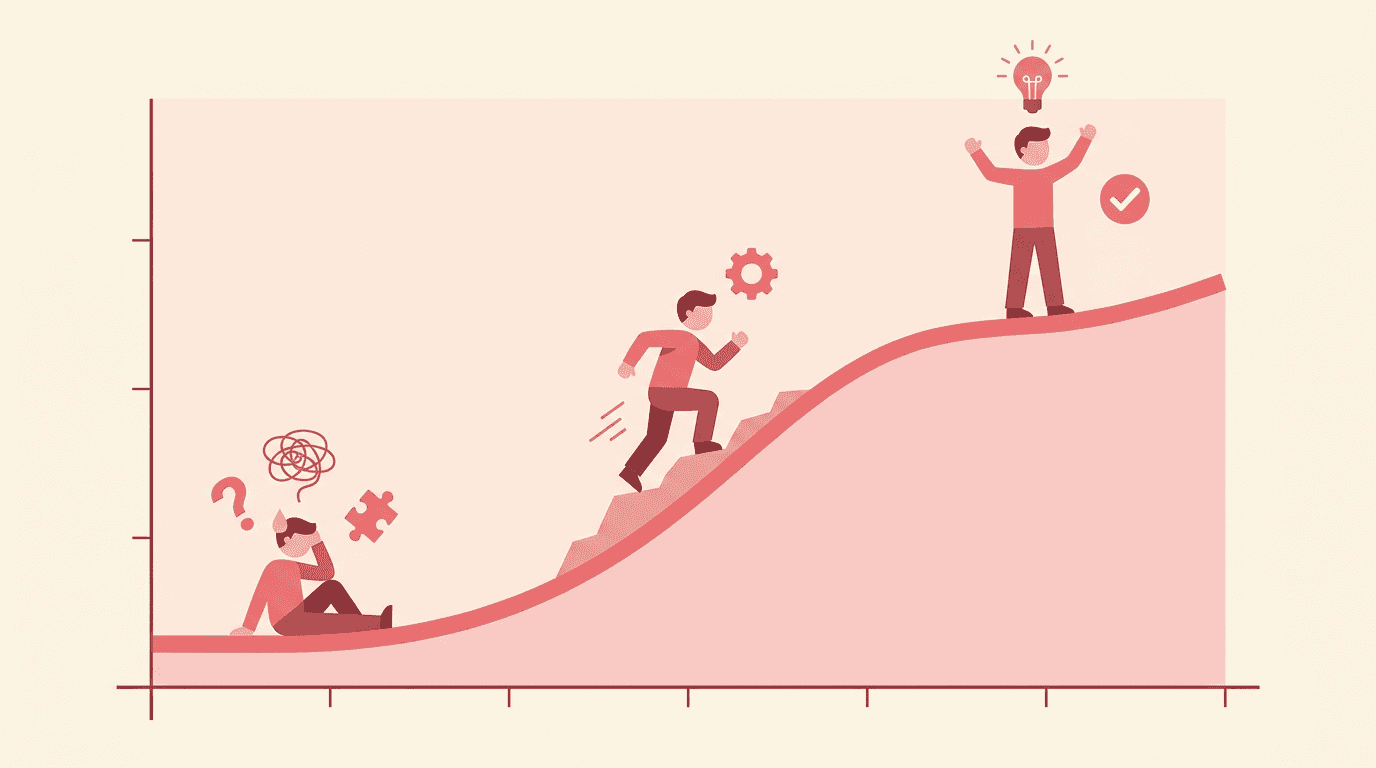
At its core, a learning curve plots how proficiency changes as practice adds up, something we can watch happen right in a classroom.
Picture a student learning two-step equations: the first few problems are slow and messy, but each round of practice chips away at the struggle.
How performance improves with practice
Graph proficiency against experience, and a pattern emerges: performance climbs with repetition, while the time or effort needed to reach the same result drops. Attempts and progress rise together, at least until the curve levels off.
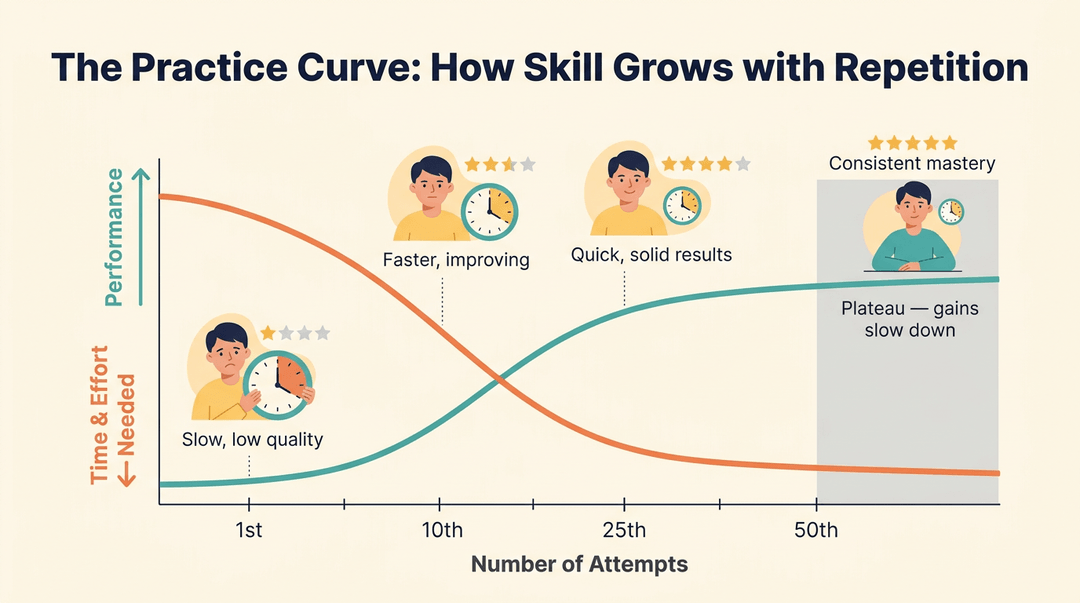
Reading the curve's two axes
The horizontal axis usually tracks experience: time, trials, or repetitions. The vertical axis tracks proficiency, though it can just as easily track time to complete a task, so check whether that line should be rising or falling. When you can't measure learning directly, you lean on proxies like quiz scores or completion time instead.
Everyday phrase versus strict measurement
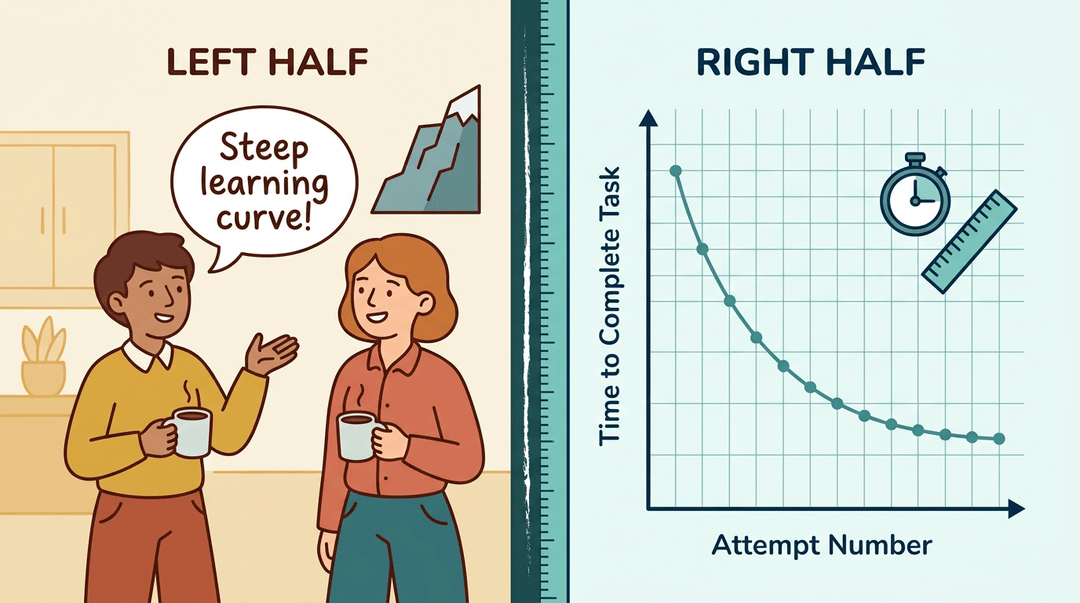
Say "steep learning curve" in the staff room, and everyone nods: it's a colloquial way to say something's hard to pick up. Mathematically, a learning curve is less about feeling hard and more about measuring a specific, repeatable task with real numbers. The casual version describes a whole subject in general; the strict version needs one task you can measure again and again.
Common Shapes of the Learning Curve
No two learning curves bend the same way. The shape depends on the task and the learner, and once you know the common patterns, you can spot which one your students are riding and pace your teaching accordingly.
Why most learning follows an S-shape
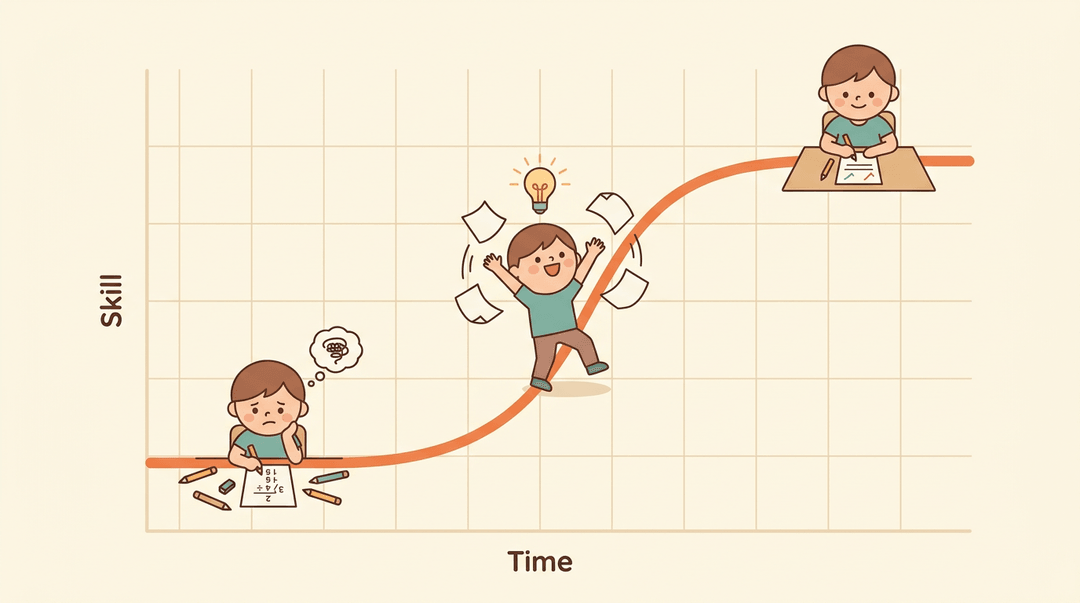
The S-curve (also called a sigmoid curve) is the idealized general shape of learning, and it's the most commonly cited model in the research.
It follows a slow-fast-slow progression: progress crawls while learners build the foundation, speeds up once the pieces click, then levels off as they close in on mastery.
Think of a student wrestling with long division: the remainder concept feels impossible at first, then suddenly makes sense and improvement takes off, before finally settling as the skill becomes routine.
Fast gains that level off
Simple or familiar tasks tend to produce rapid early gains that level off at a plateau. The start is fast because there's little to figure out.
Consider a student memorizing a short vocabulary list: the first few words come quickly, but returns shrink fast once the easy ones are gone and only the trickier words remain.
A slow start followed by rapid gains
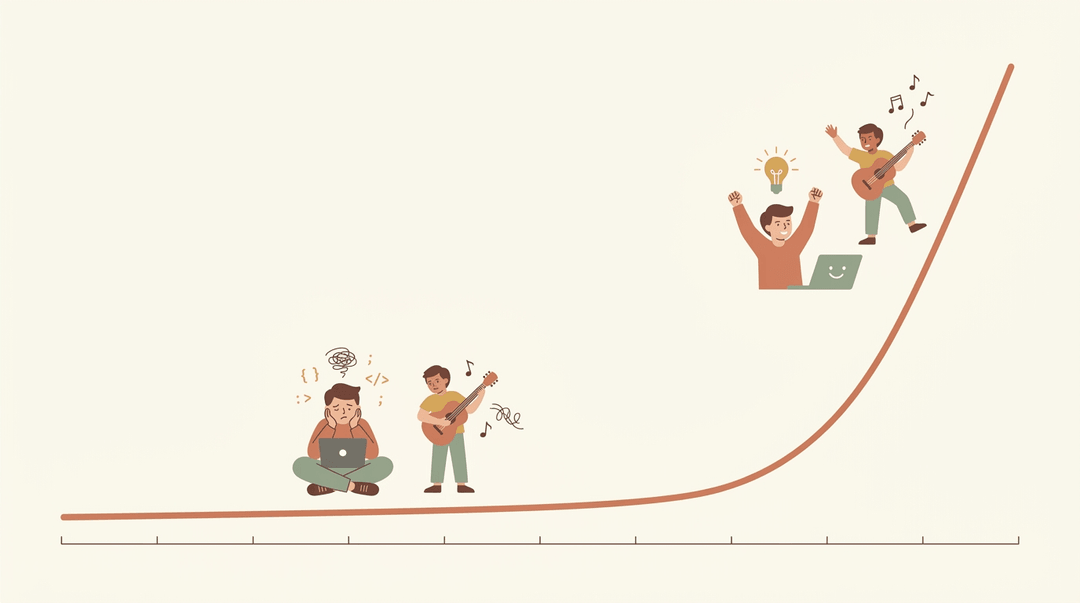
Complex tasks often flip that pattern. Progress on a genuinely hard skill can start slow, frustratingly so, before it rises later to proficiency.
A student learning to code, or picking up an instrument for the first time, might spend weeks feeling stuck before things suddenly accelerate once the underlying logic sets in.
Exponential and power law patterns
A few curves show up often enough to name directly:
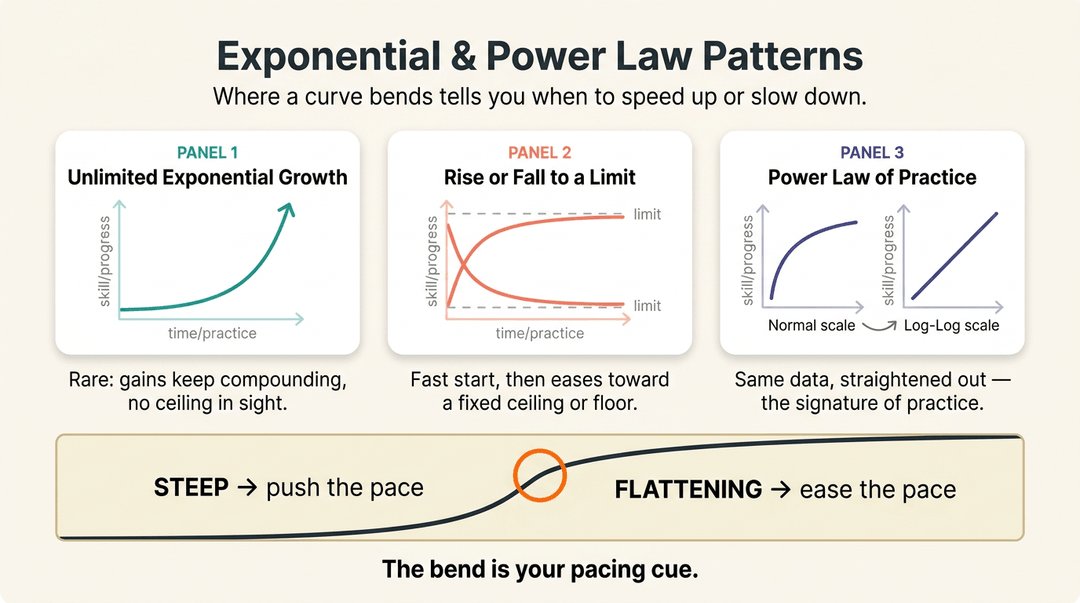
- Exponential growth (unlimited): a rare, theoretical pattern where gains keep compounding without an obvious ceiling.
- Exponential rise or fall to a limit: progress climbs (or drops) quickly at first, then eases toward a fixed asymptote.
- Power law of practice: when you plot skill against practice time on a log-log scale, the result forms a straight line, a signature researchers use to describe how practice and improvement relate over the long run.
Whatever the exact shape, the practical value is the same: watching where a curve bends tells you when to slow down or speed up your pacing.
The five-stage learning progression
Longer-term skill development often moves through five recognizable stages, rather than one smooth arc:
- An initial, unskilled starting point.
- A stage of rapid early improvement.
- A plateau, where progress seems to stall.
- Renewed improvement after the plateau breaks.
- An over-learning stage, where the skill becomes automatic.
That plateau in the middle is normal, not a sign that a student has stopped growing. It's often the setup for the next leap forward.
The Math Behind the Curve
Behind that curve on the graph is an equation doing the real work. Once you see it, "learning curve" stops being a vague metaphor and becomes something you can actually calculate.
Wright's formula for learning curves
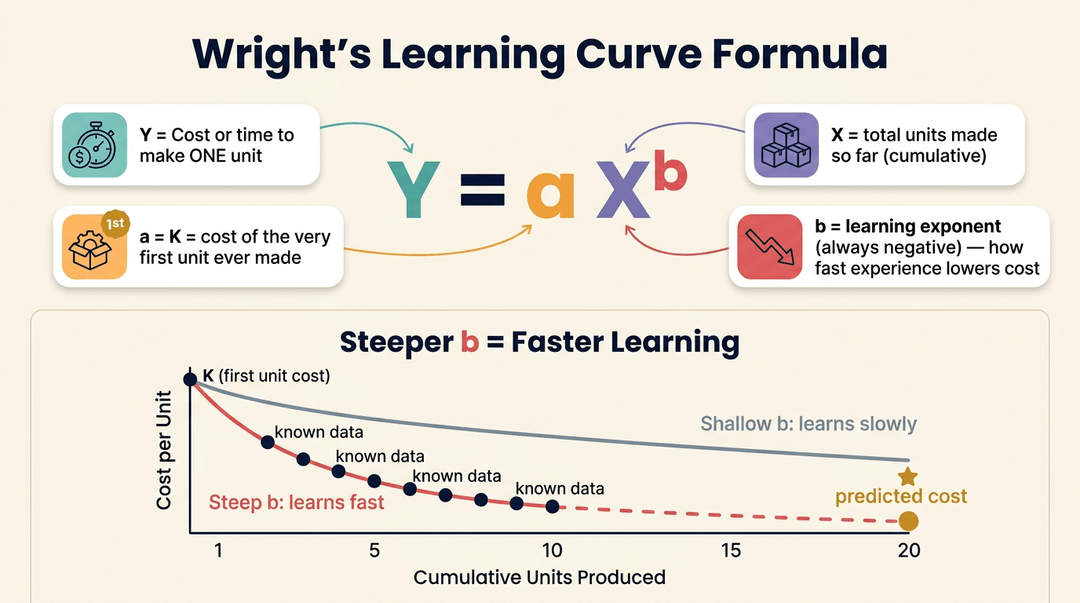
Theodore Wright's original formula is Y = aX^b.
- Y is the time or cost per unit.
- X is the cumulative number of units produced.
- a is K, the cost of that very first unit.
- b is the learning exponent: a negative number that measures how strongly experience drives costs down.
A steeper b means learning happens fast. Plug in a future X, and the formula predicts performance you haven't seen yet, estimating unit twenty from the data of the first ten.
Other models for tracking learning
Wright's formula isn't the only lens:
- Plateau model. Assumes a minimal cost floor that performance approaches but never quite reaches.
- Stanford-B model. Adjusts for learners who arrive with prior experience, so the curve starts partway down instead of at zero.
- DeJong's model. Splits a task into a machine-paced fraction and a human-paced fraction, since not every step gets faster with practice.
- S-curve model. Combines a slow start, a fast middle stretch, and an eventual plateau into one curve.
What is a good learning curve?
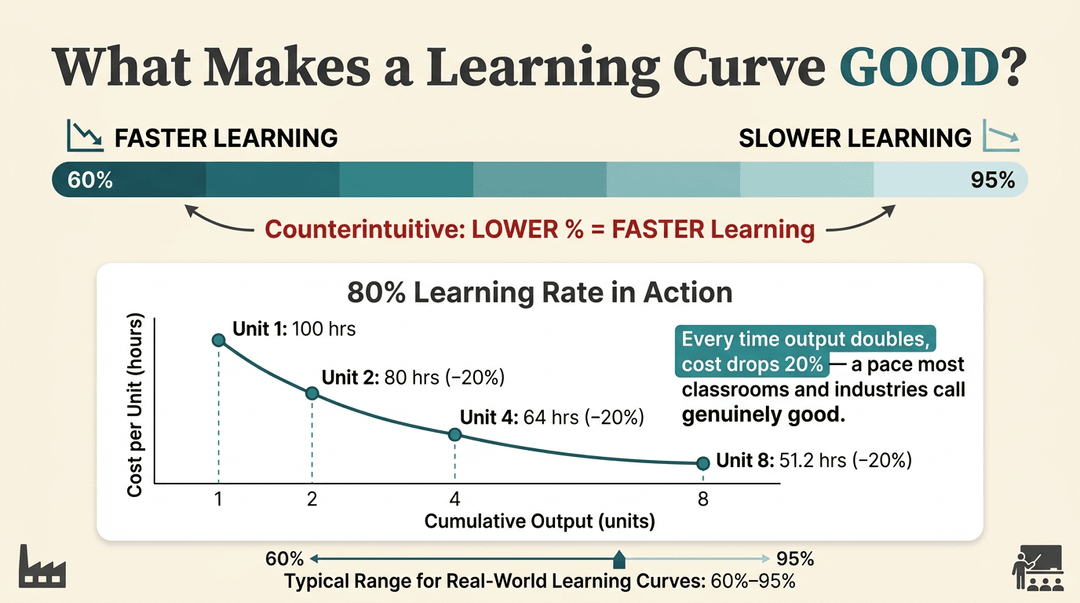
According to an industrial engineering analysis of learning curve theory, learning rates commonly fall between 60% and 95%.
Here's the counterintuitive part: a lower percentage means faster learning, since it reflects a bigger cost drop each time cumulative output doubles.
As Joseph Mahoney's course materials show, an 80% learning rate means a 20% cost drop with every doubling: a pace most classrooms and industries alike would call genuinely good.
Using the Learning Curve in Your Classroom
The learning curve isn't just theory: it's a working lens for pacing, plateaus, and progress. Here's how to put it to use in three moves.
Explain the curve to your students
Students who can see the shape of learning worry less during the slow parts.
- Draw a simple graph on the board.
- Label the x-axis "practice time" and the y-axis "skill level," then sketch the rising curve.
- Anchor it with a grade-appropriate analogy.
- Elementary: riding a bike (wobbly for days, then suddenly smooth).
- Secondary: leveling up in a game (early levels come fast, later ones take grinding).
- Connect the curve to their own practice.
- Say: "Every problem you finish moves your dot up this curve, even when it doesn't feel like it."
Spot the plateau before it stalls a unit
A flat stretch on the curve is normal; a flat stretch nobody notices is a problem. Check your pacing guide data weekly and act on what it shows:
| When you see... | Try... |
|---|---|
| Scores flat for two-plus checks in a row | Flag the student: the plateau is real, not a bad day |
| The whole class stalled on one skill | Slow the pace and reteach with a new representation |
| A few students well ahead of the pacing guide | Extension work, so they aren't held at the class pace |
Key principle: A plateau means the current approach stopped working, not that the student did. Change the method before you change the timeline.
Track proficiency growth across the year
- Use a proficiency scale, not raw percentages. A simple 1-4 works: beginning, developing, proficient, advanced.
- Chart skill mastery over time. One row per skill, one column per week: the fill pattern is your class's curve.
- Compare curves across units. If Unit 3 climbed slower than Unit 1, pacing may be the variable, not the students.
Example: A sixth-grade math teacher records a 1-4 score for "solving one-step equations" every Friday. Three flat weeks at level 2 triggers a small-group reteach with visual models, not another round of the same worksheet.
Once you're charting curves unit by unit, put them side by side: map each unit's learning curve against your standards in the Curriculum Planner's year-at-a-glance view.
Where the Learning Curve Concept Came From
"The learning curve" didn't start life as a business phrase. It moved through psychology labs, telegraph offices, and aircraft factories before it ever showed up in a meeting, and each stop reshaped what it means.
Along the way it split into two close cousins: the learning curve, which tracks how one person's performance changes with practice, and the experience curve, which tracks how a whole organization's costs drop as it scales.
Here's how that history unfolded.
Ebbinghaus and the forgetting curve
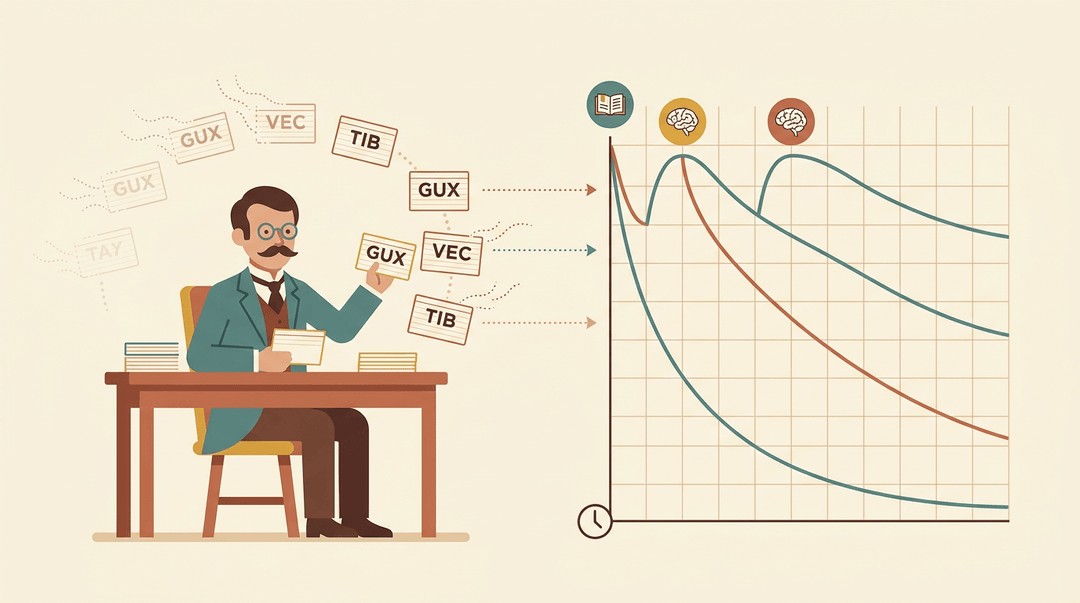
German psychologist Hermann Ebbinghaus kicked off this line of research in 1885, testing his own memory with invented three-letter nonsense syllables like GUX or VEC.
He chose meaningless syllables on purpose: real words carry prior associations that would skew the results. Ebbinghaus's nonsense-syllable experiments gave him clean data on how fast memory fades, which became known as the forgetting curve.
He also noticed something every teacher recognizes: relearning something familiar goes faster than learning it cold. Each pass back over old material takes less time than the last one did.
That single finding, that repeated practice bends the curve, is the seed of the psychology of learning.
How the term got its name
The phrase itself has roots in telegraphy, not textbooks. Bryan and Harter's study tracked railway and telegraph operators as they learned Morse code, plotting each trainee's speed against hours of practice.
The resulting line, quick early gains followed by a long, slow climb, gave the concept its name and its familiar shape.
Decades later, Arthur Bills gave the idea a fuller description in 1934, mapping achievement against time and naming the properties that keep showing up:
- the early rapid rise
- the flat stretches called plateaus
- the point where more practice returns less and less
Wright's aircraft production discovery
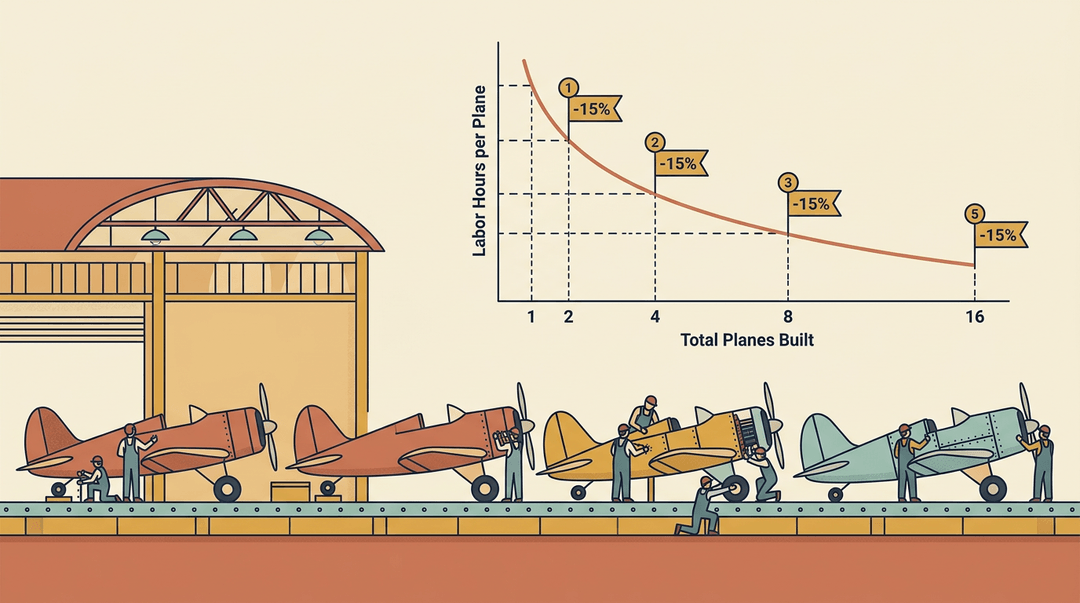
The idea jumped from psychology to industry in 1936, when T.P. Wright published an article on aircraft manufacturing showing that labor costs per plane fell as factories built more of them.
Wright modeled this with a cumulative average formula: plot cost per unit against total units built, and the line drops in a predictable curve.
Every time production doubled, labor hours per plane fell by roughly 10 to 15 percent, a pattern that held across whole factories, not just individual workers.
The BCG experience curve
Bruce Henderson, founder of the Boston Consulting Group, generalized Wright's finding in 1968.
He argued the same power law showed up well beyond aircraft: a business's total costs, not just labor, tend to drop by a consistent percentage with each doubling of cumulative output.
Consultants started calling this Henderson's Law, and studies since have found that drop typically lands somewhere between 10 and 25 percent, depending on the industry.
That's the moment "learning curve" quietly split in two: one version tracking a person's practice, the other tracking a company's scale.
The 'Steep Learning Curve' Misconception
Say "steep learning curve" in a staff meeting and everyone nods: hard. But that's not what the phrase actually means, and clearing that up changes how you talk about student progress.
What steep really means technically
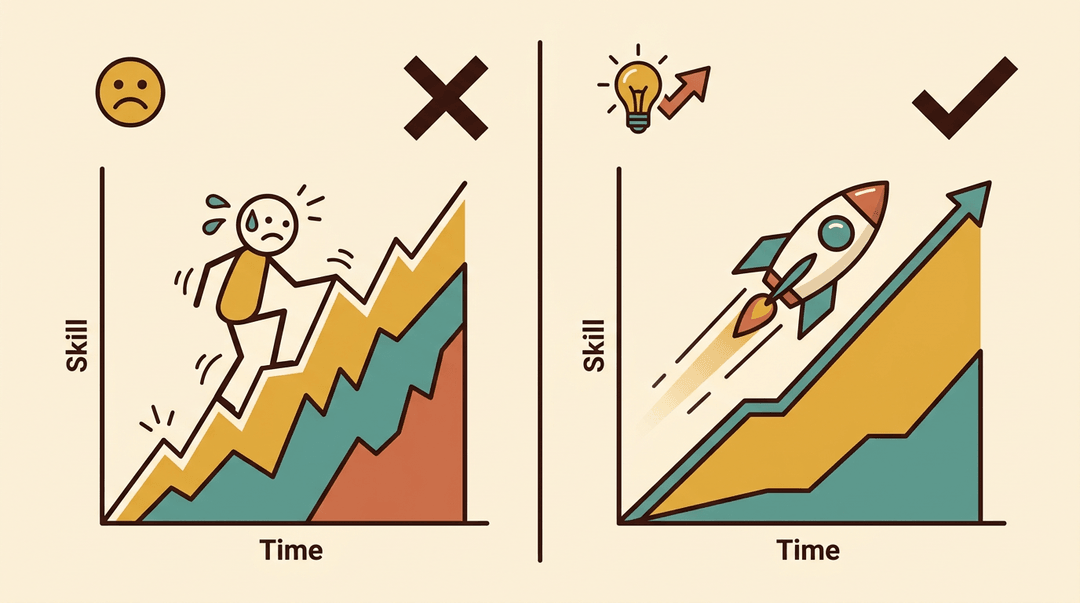
The common usage treats steep as a synonym for difficult, a curve you dread climbing. Technically, though, steep describes rate, not difficulty: a steep learning curve means rapid progress, learning fast, not learning painfully.
Dictionary definitions back the rate meaning, not the popular one. So when a task is genuinely hard to pick up slowly, the phrase is actually backwards.
Short and long curves instead of steep
Because "steep" causes so much confusion, many now swap shallow and steep for short and long instead. A short curve gets you competent fast; a long one takes time to master.
Think of Notepad versus Vim: Notepad's curve is short, you're productive in minutes, but it does little. Vim's curve is long, demanding real investment, but it rewards you with far more power once you're through it.
That's the real tradeoff: functionality against ease.
Where the phrase shows up in culture
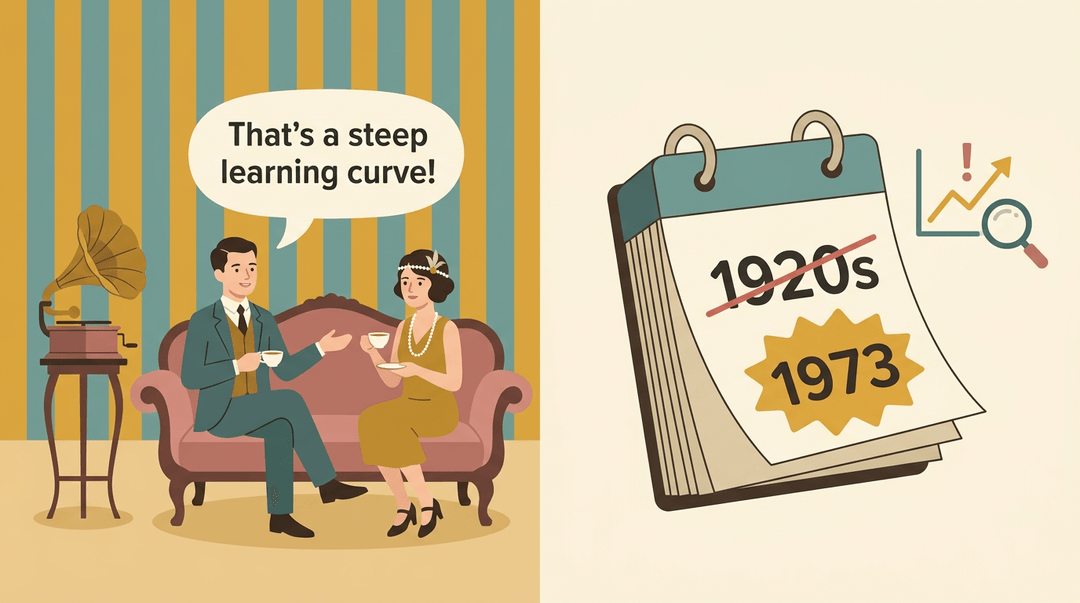
The mix-up even made television history. Linguist Ben Zimmer noted a glaring anachronism when a Downton Abbey character used "steep learning curve" decades before it existed.
His research found that people didn't start talking that way until the 1970s, with the phrase's first steep usage traced to 1973.
Learning Curves in Business and Industry
Outside the classroom, the learning curve is a working tool that companies use to plan budgets, set prices, and decide staffing levels. It's less about a single lesson and more about what happens across thousands of repetitions.
Estimating costs in manufacturing
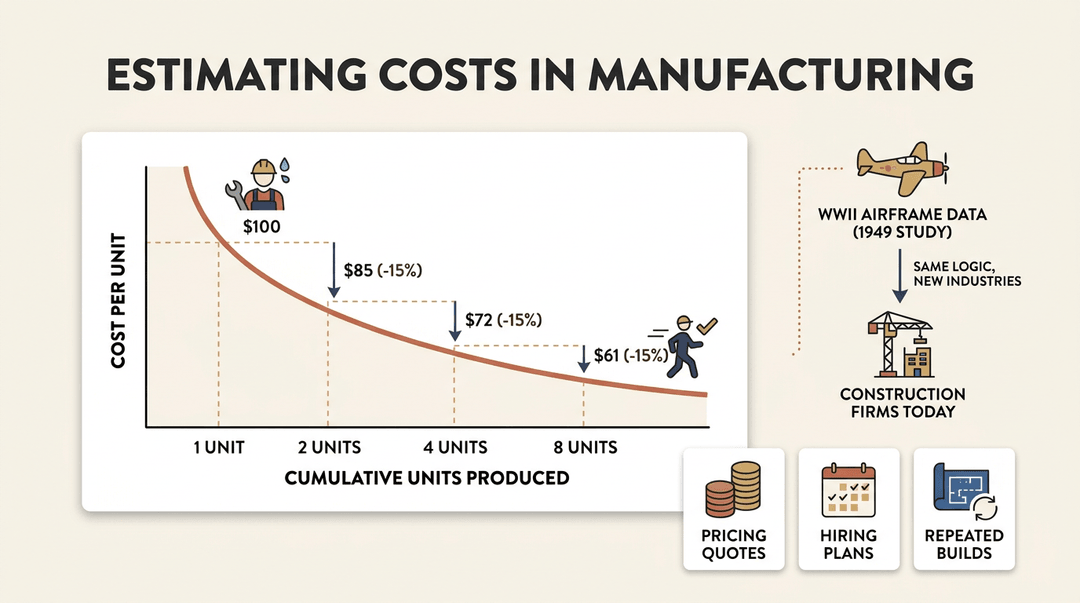
Manufacturers plot unit cost against cumulative production, not against time. Each doubling of output tends to shave a consistent percentage off the cost of the next unit, as workers and processes get more efficient.
This idea has deep roots: a 1949 study on airframe production used actual World War Two manufacturing data to test whether this cost-to-output relationship held true across different plane makers, and it became a foundation for cost modeling in aerospace.
Construction firms use the same logic to forecast costs on repeated builds, and it directly shapes pricing quotes and hiring plans for new production runs.
Guiding business and management strategy
Beyond costing, the curve steers strategy. Companies price new products low, expecting costs to fall as they climb the curve and gain experience. Planners use it to forecast inventory needs and demand as production scales.
It also informs when to switch production lines to a new model, and how to structure teams and workflows so that experience actually compounds instead of resetting with every shift change.
Learning curves in modern technology
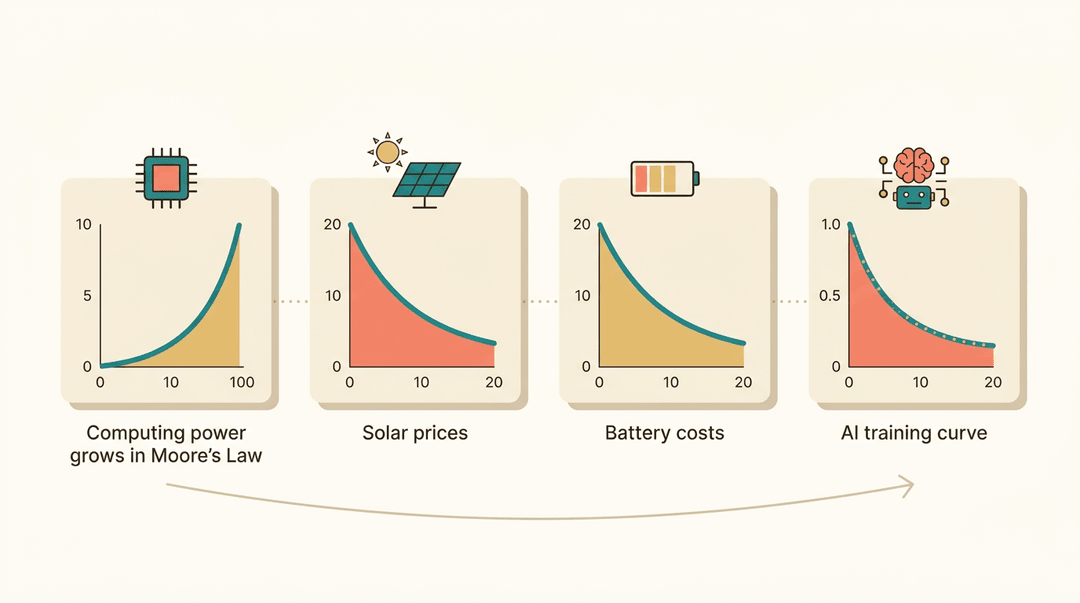
The same shape shows up across tech. Moore's law describes computing power doubling on a predictable curve. Solar panel prices and lithium-ion battery costs have both dropped in step with cumulative production.
Even artificial intelligence, computer systems built to perform tasks that normally need human thinking, follows this pattern: AI scaling laws and the training curves that track a model's error rate over time both mirror the same underlying idea.
What Is an Example of a Learning Curve?
Abstract definitions only get you so far. The clearest way to understand a learning curve is to watch one play out, and you'll find them in medicine, gaming, and even a paycheck.
Learning curves in medicine
Consider a surgeon learning a new procedure for the first time. The earliest attempts take longer and carry more risk, but with each repetition, speed climbs and complication rates fall: a textbook learning curve. Hospitals actually track this.
By watching where a surgeon's proficiency plateaus or dips, administrators can spot exactly who needs more supervised reps or simulation training before operating solo.
Learning curves in video games
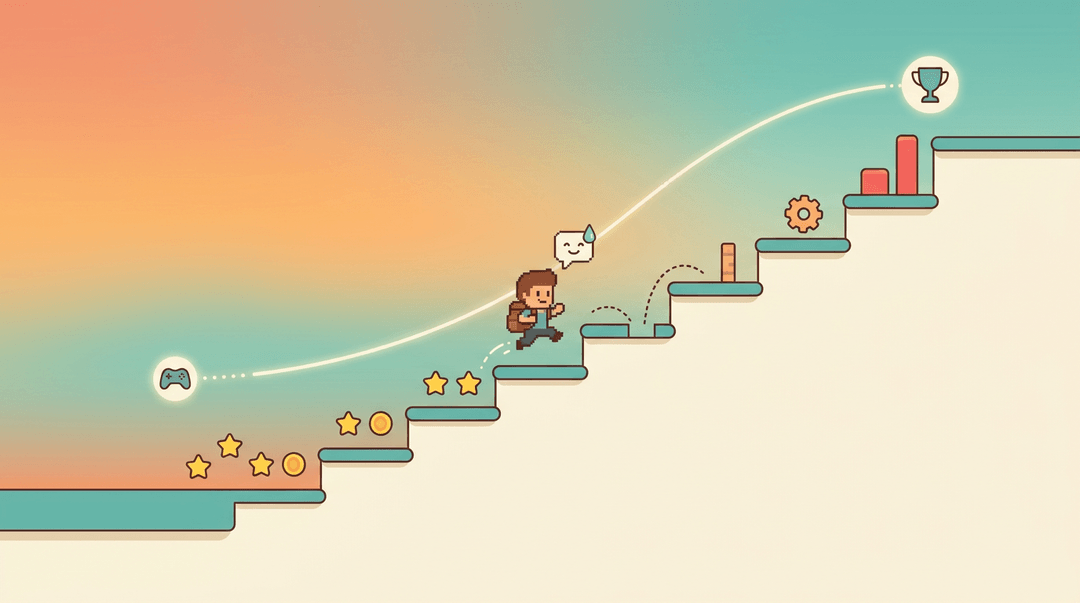
Game designers build on the same idea, calling it a difficulty curve. Levels ramp up just ahead of the player's current skill, which is the heart of good game balance: too flat and players get bored, too steep and they quit.
The best games create an illusion of winnability: the challenge feels hard but always beatable, which keeps players trying one more round. That's a useful model for game-based lesson design.
Structure a unit like a well-paced level: each task just past what students can already do, so they feel challenged, not defeated.
Learning curves and worker wages
Learning curves show up in paychecks too. When a company introduces new software or shifts a worker into an unfamiliar role, output usually dips before it recovers, and workers often resist the change because slower output can mean slower pay.
Some employers adjust pay or quotas during that ramp-up period, recognizing the dip as a normal part of the curve rather than a performance problem.
Strengths and Weaknesses of the Model
Like most models, the learning curve earns its keep by simplifying reality, and it can mislead you for that same reason. Knowing what it's good for, and where it wobbles, keeps you from reading too much into a single graph.
Why the learning curve model helps
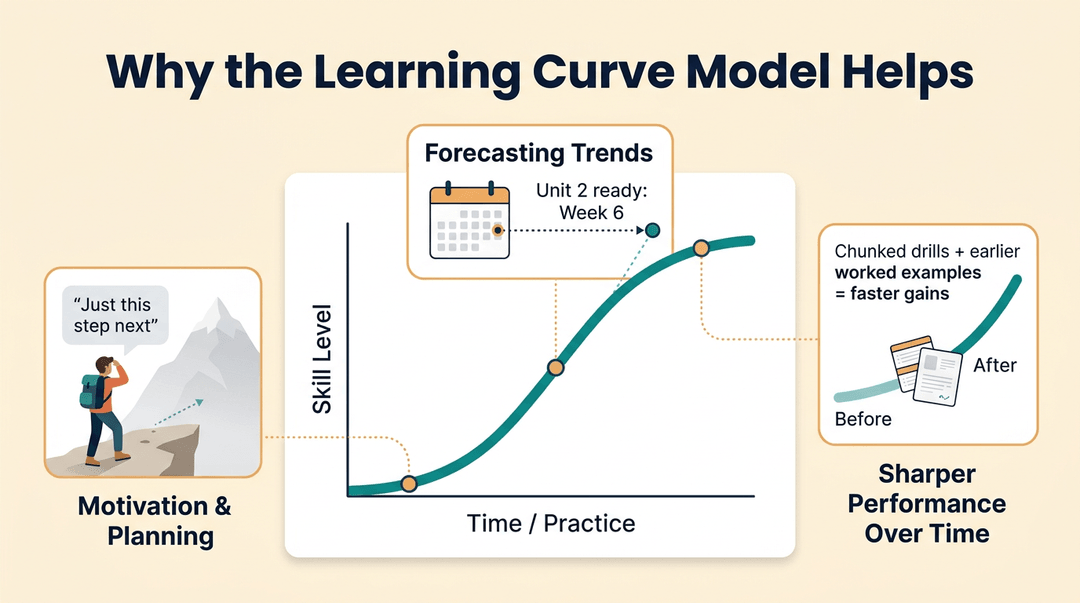
The curve gives you something concrete to plan around. It helps in a few ways:
- Motivation and strategic planning. Seeing progress mapped out, even a bumpy one, keeps students and teachers focused on the next step rather than the whole mountain.
- Forecasting trends. A steady curve lets you predict roughly when a class will be ready for the next unit, so pacing guides feel less like guesswork.
- Sharper performance over time. Watching the curve shows where practice is paying off and where a different technique might shorten it faster: think chunking a skill into smaller drills or adding worked examples earlier in the unit.
What can throw off the results
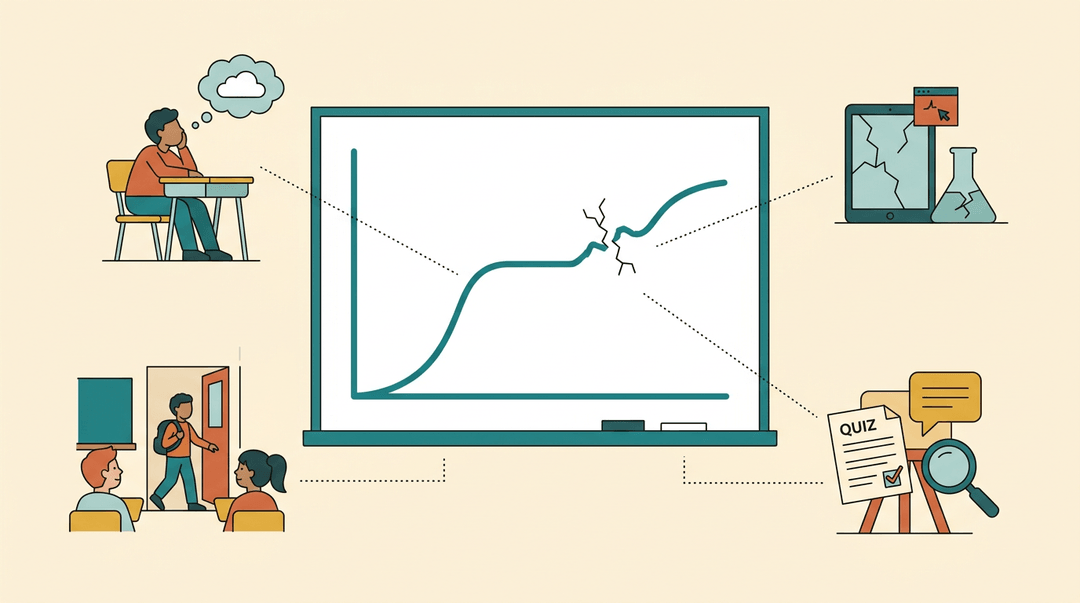
The curve only holds up if its assumptions hold up too.
- Assumes stable motivation. A student who checks out halfway through won't follow the smooth arc the model predicts.
- Equipment issues. A glitchy tablet or a broken lab kit skews the data. That's a tools problem, not a grasp-of-the-skill problem.
- Turnover. A new student joining mid-unit, or a long-term sub stepping in, resets part of the curve without the class actually regressing.
- Not a stand-alone predictor. Pair it with other evidence, like quizzes, observation, and conversation, before drawing conclusions from the shape alone.
The learning curve isn't just a business chart or a classroom cliché. It's a genuine pattern you can spot, measure, and use: fast early gains, a plateau, and steady growth from there. Once you know the shape, you can plan around it instead of guessing.
Ready to build that pacing right into your lessons? Check out our Curriculum & Standards tool to map units and lessons that match how your students actually learn.
References
- Memory — pressbooks.bccampus.ca
- Learning Curve — ijrcs.org
- Joseph Mahoney's Home: BADM 449 Spring 2006 Handout #10 — josephmahoney.web.illinois.edu
- Language Log » Learning curves: up and down, steep and shallow — languagelog.ldc.upenn.edu
- Learning and forgetting in the jet fighter aircraft industry — pmc.ncbi.nlm.nih.gov
- Reliability of Progress Curves in Airframe Production. Revision 3 — apps.dtic.mil
- Skill — doi.org (2002)
- How can Australian manufacturing leverage Wright’s Law? — strategyaudit.com.au
- Learning Curve — psynso.com
- 1. Learning Curve Theory 2. Crawford Model 3. Total ... — industrialeblog.files.wordpress.com
- A "Steep Learning Curve" for "Downton Abbey" : Word Routes : Thinkmap Visual Thesaurus — visualthesaurus.com
- A "Steep Learning Curve" for "Downton Abbey" : Word Routes : Thinkmap Visual Thesaurus — visualthesaurus.com
Frequently asked questions
What is meant by learning curve?
A learning curve is the pattern of how performance or proficiency changes as someone gains practice over time. Performance often improves quickly at first and then increases more slowly as mastery develops.
What is a good learning curve?
A good learning curve shows meaningful improvement with practice and eventually reaches consistent proficiency. In industrial terms, learning rates commonly range from 60% to 95%, with a lower percentage indicating faster learning. An 80% rate is often considered good because costs fall by 20% whenever cumulative output doubles.
What is a learning curve in simple terms?
In simple terms, a learning curve shows how someone gets better at a task through practice. It often starts with mistakes, improves with repetition, and eventually levels off when the skill becomes familiar or automatic.
What are the four types of learning curves?
Four commonly discussed learning-curve patterns are the S-curve, rapid early gains followed by a plateau, slow initial gains followed by rapid improvement, and exponential or power-law patterns. These describe different rates and shapes of improvement over practice.
What is an example of a learning curve?
Learning to ride a bicycle is a common example. A beginner may wobble and fall at first, then improve with practice until balancing and pedaling become nearly automatic.
What are some examples of learning curves?
Examples include learning to ride a bike, solving two-step equations, memorizing vocabulary, learning to code, playing an instrument, performing a surgical procedure, and using new workplace software. Manufacturing also uses learning curves to track how unit costs decline as cumulative production increases.
What does it mean when someone says it's a learning curve?
When someone says something is a learning curve, they usually mean it takes time and practice to become comfortable or proficient. The phrase often implies that early attempts may be difficult or inefficient before performance improves.
What does it mean when people say it's a learning curve?
It means that mastering a skill, process, or tool requires a period of practice and adjustment. In everyday speech, people often use the phrase to acknowledge that something is initially challenging, even though progress is expected over time.