Scoring Scale for ACT Explained: From 1 to 36
Jump to section
Think about the last time a student handed you a test score and asked, "Is this good?" You looked at the number, and for a second, you needed a little context before you could answer. ACT scores work the same way.
A 24 doesn't mean much on its own until you understand the scale behind it, the benchmarks that frame it, and the decisions that hinge on it.
The ACT scoring scale runs from 1 to 36, built from four subject tests and averaged into a single composite. It's a system with real nuance, and knowing how it works makes you a better guide for your students.
This post walks through how the scale is built, what changed in 2025, how to read score reports with your class, and how to have honest conversations about retakes and college readiness.

The ACT Scoring Scale Explained
The ACT doesn't just hand you a number: it layers several scores together to give a complete picture of where a student stands. Here's how each piece fits.
How the composite score is calculated
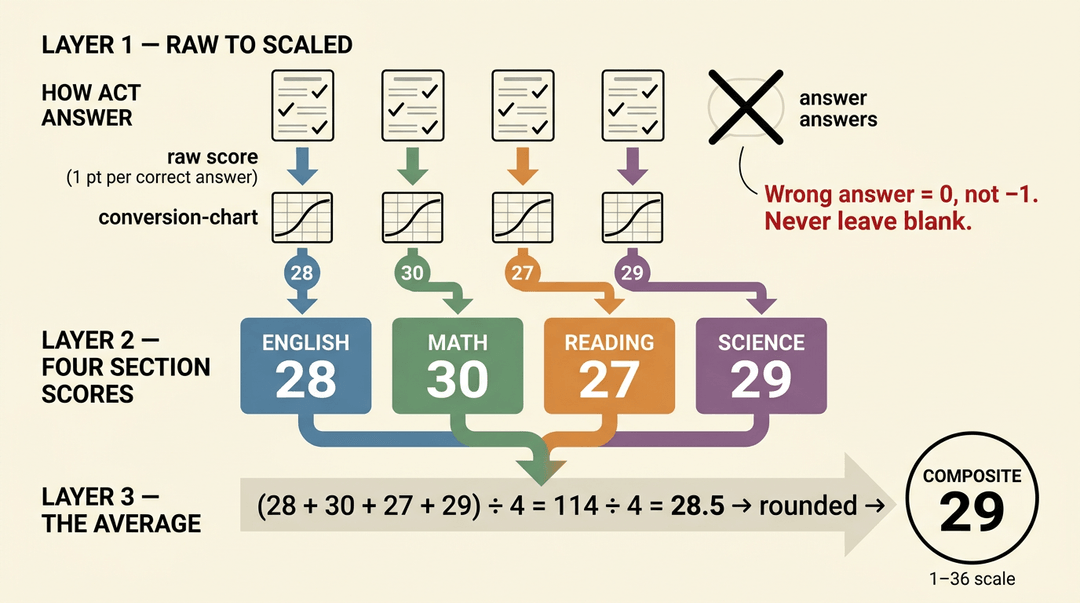
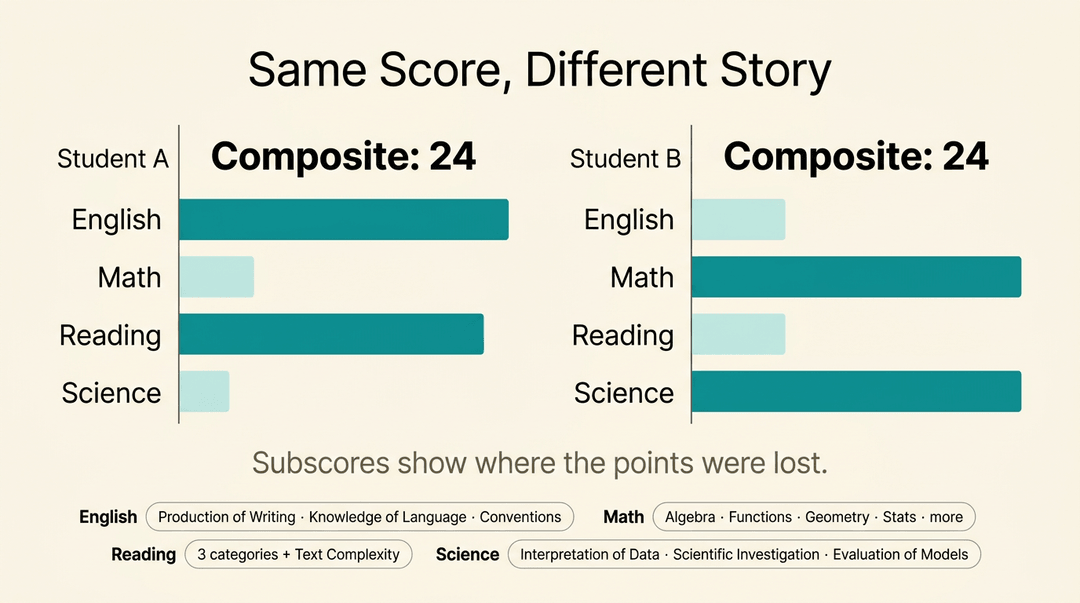
The composite score runs on a 1–36 scale. ACT calculates it by averaging a student's four section scores (English, Math, Reading, and Science), then rounding to the nearest whole number. A student who scores 28, 30, 27, and 29 lands at a composite of 29.
Before any of that happens, a raw score (one point per correct answer) is converted to a scaled score using a conversion chart that adjusts for slight differences in difficulty across test dates.
There's no penalty for wrong answers, so students should never leave a question blank.
What each section score covers
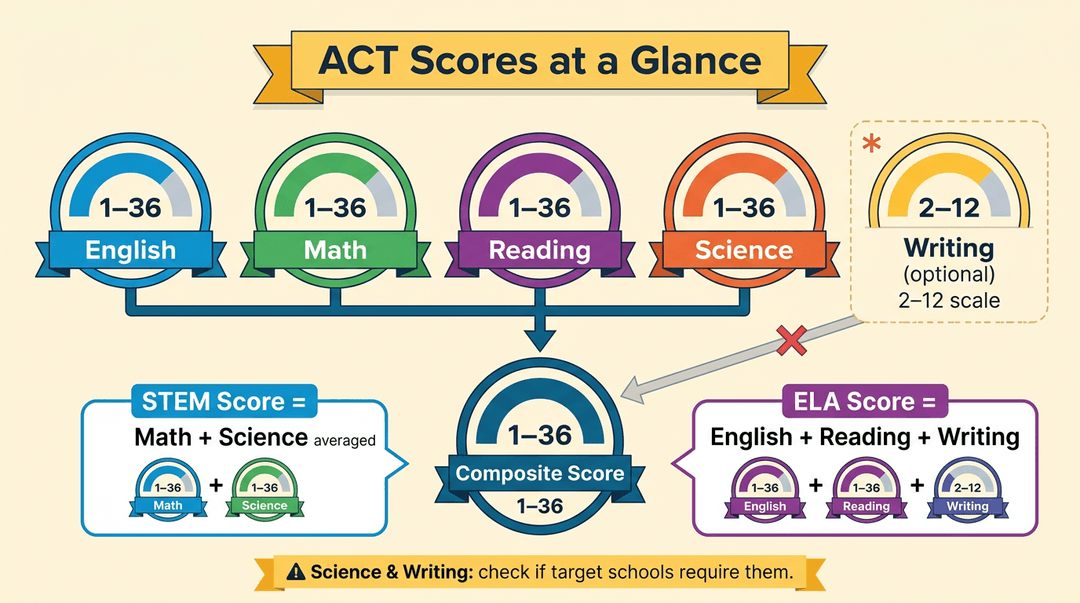
Every section sits on the same 1–36 scale:
- English, Math, Reading, and Science are each scored 1–36 and make up the composite.
- Writing is optional and scored separately on a 2–12 scale (it does not affect the composite).
- The STEM score averages Math and Science.
- The ELA score averages English, Reading, and Writing.
Science is optional for some testing formats, and Writing is optional nationwide; check whether a student's target schools require either.
How ACT Writing is scored
The essay is evaluated across four domains:
- Ideas and Analysis
- Development and Support
- Organization
- Language Use and Conventions
Two trained raters each score the essay 1–6 per domain. Those eight subscores are summed to produce a Writing total of 2–12.
The national average sits around 6–7. Because the Writing score is reported separately, a lower essay score won't drag down a student's composite.
Reporting categories and subscores
Each section breaks down into reporting categories tied to the College Readiness Standards, giving a raw score and a percentage correct for each:
- English: 3 categories (Production of Writing; Knowledge of Language; Conventions of Standard English)
- Math: 8 categories, covering everything from algebra to statistics
- Reading: 3 categories plus a text complexity indicator
- Science: 3 categories (Interpretation of Data; Scientific Investigation; Evaluation of Models)
These subscores are where the real diagnostic value lives. A composite of 24 can hide very different profiles depending on where the points are lost.
How percentile rankings work
Percentile rankings show how a student's scores compare to recent high school graduates nationally and, where available, by state. ACT reports percentiles for eight score areas: the composite, the four section scores, Writing, STEM, and ELA.
Because the comparison group updates periodically, percentiles shift slightly from year to year. A 30 composite currently sits around the 94th percentile nationally, but always verify against the current year's tables.
What Changed About the ACT in 2025
The ACT got a significant redesign in 2025, and if you're helping students interpret their scores, the structural shifts matter. Here's what's different:
Structural changes to the 2025 test
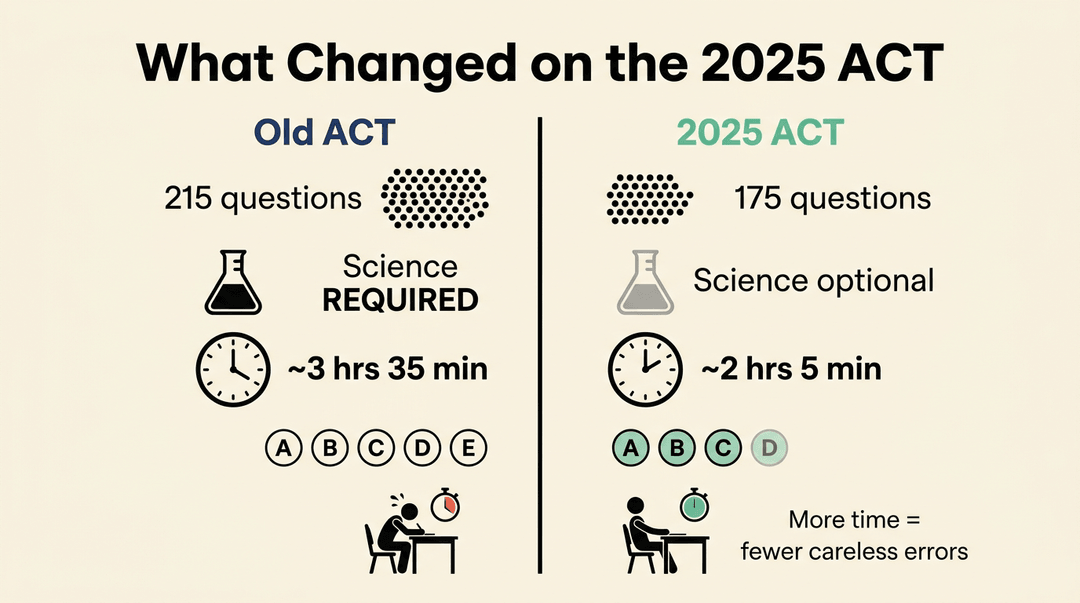
The redesigned ACT is leaner across the board:
- Total questions dropped from 215 to 175
- Science is now optional, not a required section
- Test duration runs roughly 125 minutes without the optional sections
- Math answer choices reduced from five to four
- More time per question is built into each section
For students who struggle with pacing, that last point is meaningful. Less rushing often means fewer careless errors.
How the composite is recalculated now
This is the change most likely to trip up score conversations. The composite now averages only three sections: English, Math, and Reading. Science no longer factors into the composite.
A STEM score (combining Math and Science) is still available as a separate reported score. And the scale itself hasn't moved: scores still run 1–36, and ACT has confirmed that scores remain comparable to pre-2025 results.
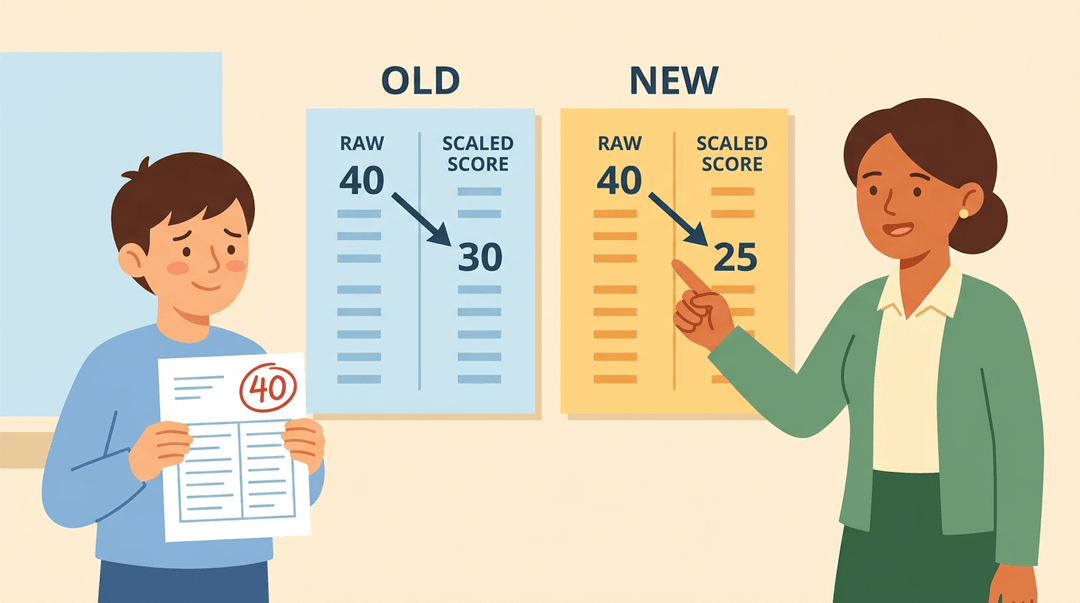
Raw-to-scaled conversion after the redesign
With fewer questions per section, the raw-to-scaled conversion tables have changed. A raw score of 40 on the old Math section and a raw score of 40 on the new one don't land in the same scaled place.
ACT provides section-specific conversion tables for each test form, and estimates can vary between forms. When a student asks what their raw score means, point them (or yourself) to the table for that specific test, not a generic chart.
Using ACT Score Reports in Your Classroom
A score report is a teaching document, not just a number. Reach for this guide when a student hands you their report and you want to turn it into a plan: read it, find the gaps, and decide what comes next.
Read the report in three passes
Work top to bottom, narrowing as you go.
- Find the composite first. The big number, an average of the four section scores.
- Drop to section scores. English, Math, Reading, Science, each on the same scale.
- Read the reporting-category percentages. The bars under each section: percent of points earned per skill area.
- Lay the benchmarks beside each section. College Readiness Benchmarks predict likely success in matching college courses.
Example: A student with a 24 composite but a Math reporting category reading 48% in "Higher Math" looks fine on the surface. The category percentage is where the real gap hides.
Turn percentages into a skill plan
Reporting categories are your bridge from the score to your curriculum.
- Flag every category under 50%. These are your candidates, not yet your priorities.
- Map each flagged category to your standards. "Integrating Essential Skills" → multi-step problem solving in your unit sequence.
- Prioritize by leverage, not by lowest number. Fix what feeds the most downstream skills first.
💡 Tip: A weak category that underpins three later units beats a slightly weaker one that stands alone. Sequence your reteaching, don't just chase the red bars.
Help students decide on a retake
A retake is worth it only when there's room to grow and time to use it. Walk through three checks together.
| When you see... | Then... |
|---|---|
| Score below the target school's 25th percentile | A retake likely moves the needle; plan it |
| Score at or above that 25th percentile | Weigh the effort against marginal gain |
| Strong sections, one weak section | Check superscore eligibility before retaking all four |
| Test date under 6 weeks away | Set a realistic, narrow prep focus, not a full review |
Superscore in plain terms. Many colleges combine a student's best section scores across multiple test dates into one composite. If your student already has a strong Reading, a retake can target only the weak section.
Adapt the report to your setting
The same report serves different roles by grade level.
- High school: integrate directly. Use category gaps to drive bell-ringers and unit review.
- Middle school: build benchmark awareness early. Frame the pre-ACT as a baseline, not a verdict.
- Homeschool: use scores for transcript context. They give an outside reference point colleges recognize.
⚠️ Watch out: Don't present a single report as a fixed ceiling, especially in middle school. It's a snapshot of skills on one day, and skills are exactly what we teach.
At a glance: read top-down → flag categories under 50% → map to standards → check retake against the 25th percentile and superscore → adapt by grade.
Once you've spotted a student's benchmark gaps, track those ACT benchmarks alongside classroom grades in EMStudio's gradebook to see whether the same patterns show up across your own assessments.
What Is a Good Score on the ACT Scoring Scale
"Good" depends entirely on where your student is headed. A score that opens doors at one college may fall short at another, so it helps to think in ranges rather than a single magic number.
Is a 27 a good ACT score?
The short answer: yes, for most schools. Here's how the ranges break down in practice:
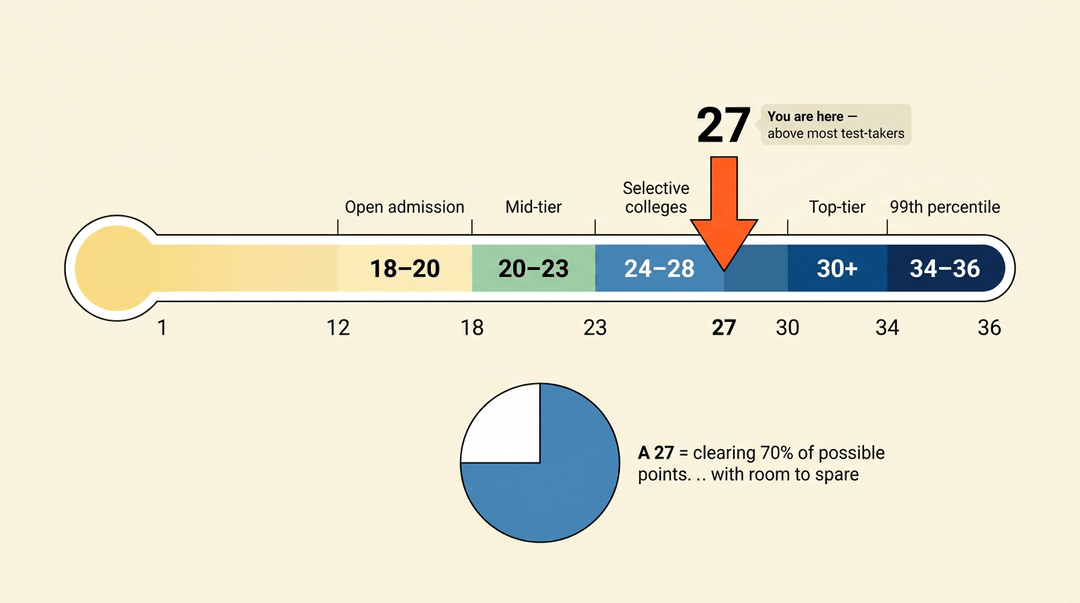
- 18–20: Qualifies for open-admission colleges, where acceptance is broadly available.
- 20–23: Competitive at mid-tier colleges with moderate selectivity.
- 24–28: A strong range for selective colleges. A 27 lands comfortably here, putting a student above the majority of test-takers.
- 30+: Expected at top-tier universities, where applicant pools are highly competitive.
- 34–36: 99th percentile territory, the range elite schools see from their strongest applicants.
A 27 is a genuinely good score. It's not a ticket to Harvard, but it's well above average and competitive at hundreds of four-year colleges.
As a point of reference, scoring around 25 on a 36-point scale is roughly equivalent to hitting 70% of the possible points, so a 27 clears that bar with room to spare.
Where the national average actually lands
According to ACT's own score-understanding resource, the 2024 national average composite was 19.4. Scores between 21 and 26 are generally considered above average. Section averages cluster between 20 and 21, and the average Writing score sits around 7.
Any composite above 20 already clears the national bar.
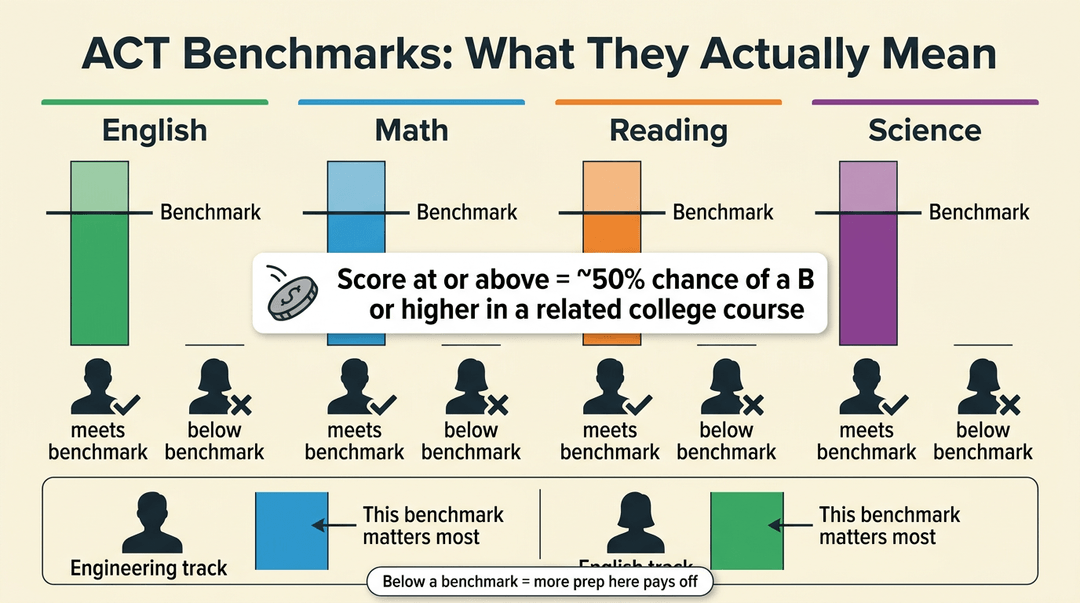
ACT College Readiness Benchmarks by subject
The benchmarks are a different lens entirely.
As ACT's benchmark research explains, they're empirically derived from actual student performance in college: hitting a benchmark signals roughly a 50% chance of earning a B or higher in a related first-year course.
Each subject has its own threshold, and whether a student meets them depends partly on their intended major. A student planning to study engineering needs to clear the math benchmark; a future English major has different priorities.
Benchmark attainment is one of the most useful diagnostic signals you can share with a student: it flags exactly where more preparation would pay off.
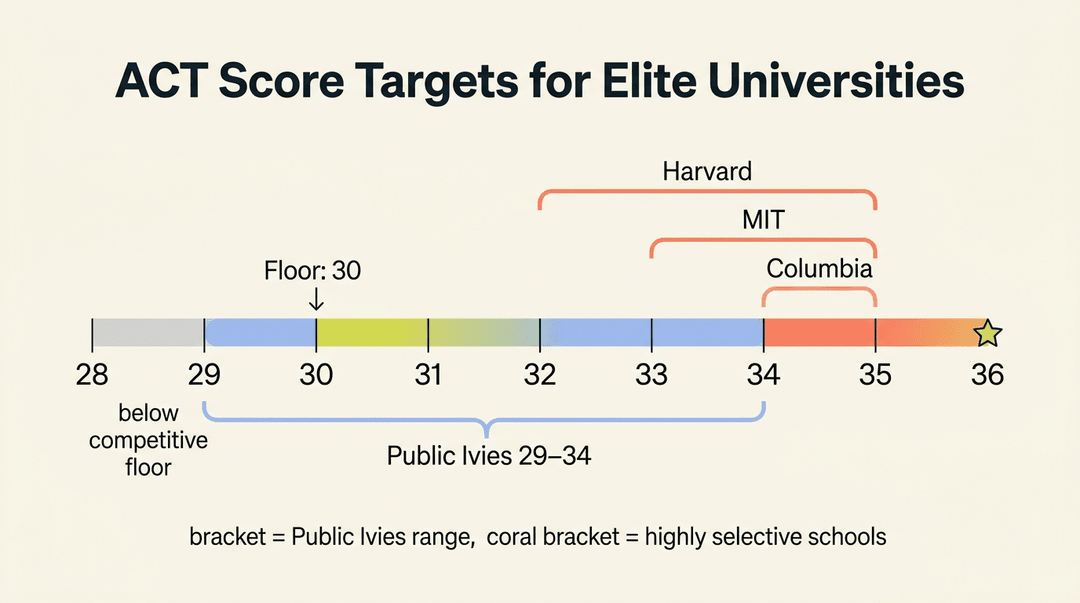
Score ranges at elite universities
For students aiming at highly selective schools, the middle-50% ranges set a realistic target. Harvard's admissions FAQ shows a 10th-to-90th-percentile range of 31–36, with the middle 50% sitting around 32–35. MIT's middle 50% runs 33–35.
The Columbia Class of 2027 profile puts its middle 50% at 34–35 for students who submitted scores. Public Ivies typically land in the 29–34 range. As a practical floor, a 30 is widely considered the minimum worth targeting for top-school competitiveness.
How ACT Scores Affect College Admissions
A score matters, but it's rarely the whole story. Understanding where it fits, and how to use it strategically, helps you guide students toward the right next step.
Where ACT scores fit in holistic admissions
Most colleges weigh the ACT as one factor among many. GPA, essays, and extracurriculars all share space in an admissions file, so a 28 doesn't guarantee acceptance any more than a 34 guarantees a full ride.
That said, a strong score can offset a lower GPA, and many merit scholarships set explicit ACT minimums.
Worth noting: the number of test-optional schools has grown considerably, so check each college's current policy before advising a student on whether to submit.
Scores are typically released within two to eight weeks of the test date, accessible through a student's ACT web account.

How superscoring works to your advantage
Superscoring means a college takes the highest section scores across multiple test dates and averages them into a new composite. Many colleges accept superscores, which lowers the stakes of any single test day.
Under the 2025 format, the English, Math, and Reading sections count toward a superscore (Science is now a separate, optional section).
That detail matters when you're counseling a retake: if a student scored well on two sections but struggled on one, retaking specifically to lift that section can produce a meaningfully better superscore composite.

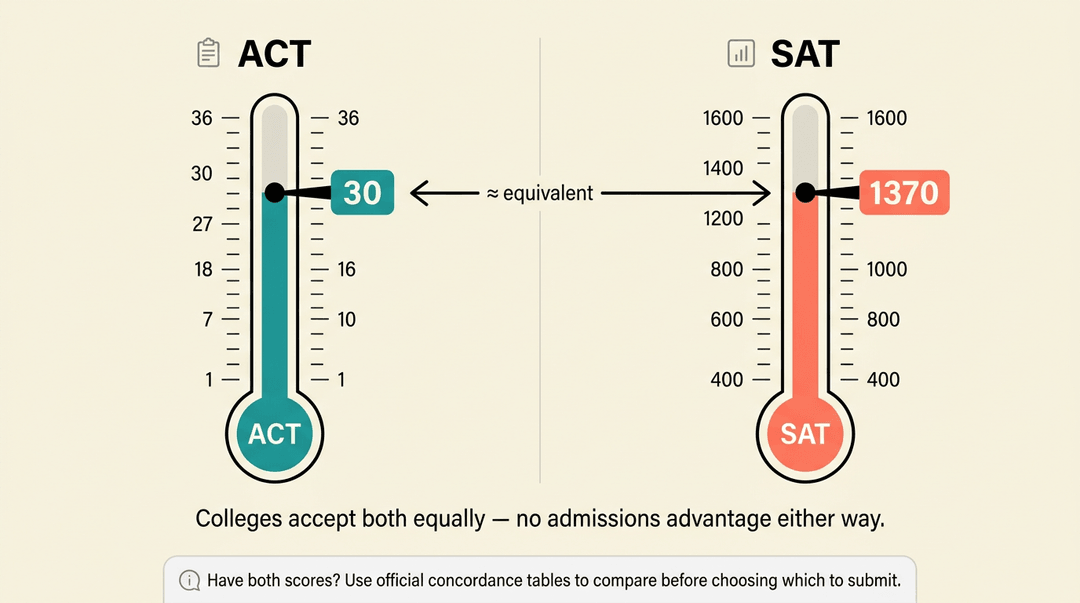
ACT vs SAT scores compared
The ACT runs on a 1–36 scale; the SAT runs on a 400–1,600 scale. Both are accepted equally by colleges, so students don't gain an admissions edge by choosing one over the other.
Official concordance tables let you compare across scales: an ACT 30 is roughly equivalent to an SAT 1370. If a student has taken both, compare using those tables before deciding which score to submit.
When retaking the ACT makes sense
A retake is worth considering when a student scores below a target school's 25th percentile, or when minimal prep preceded the first attempt.
Because superscoring rewards retakes and most colleges consider only the highest composite, there's little downside to a well-prepared second sitting. Help students set a concrete target score before they register again, not after.
ACT Score Validity and Equity Concerns
ACT scores carry real weight, but they don't tell the whole story. Understanding what the score actually predicts, and where its limits lie, helps you give students and families honest guidance.
How well ACT scores predict college success
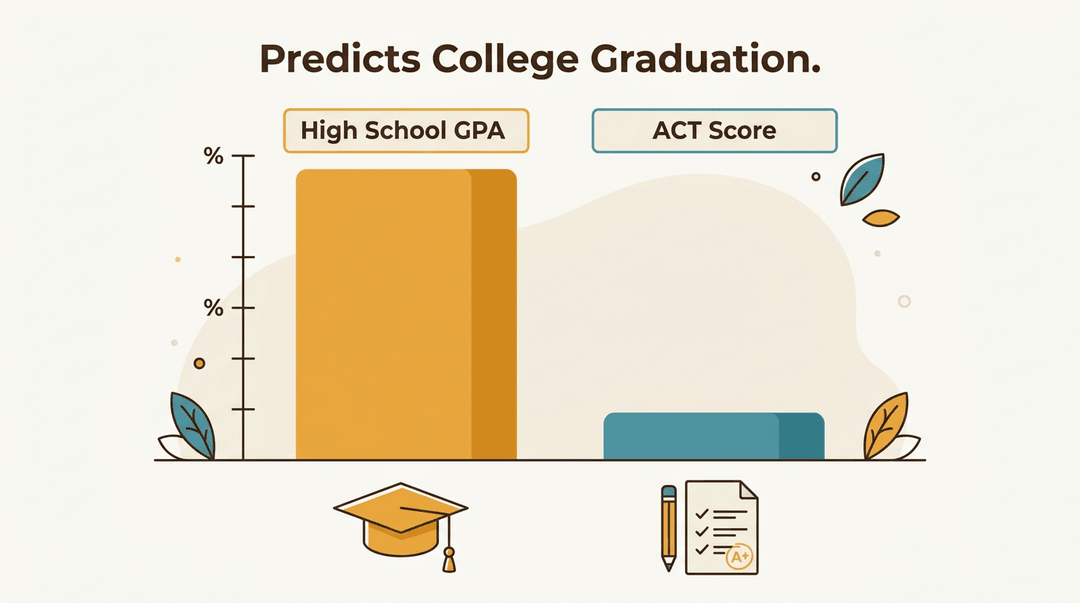
The ACT has genuine predictive value, but it's modest.
A study published through Northwest Missouri State University found a correlation coefficient of just 0.383 between ACT scores and final college GPA, meaning the test explains a fraction of college performance.
Meanwhile, research from the UChicago Consortium on School Research found that high school GPA predicts college graduation at a rate five times stronger than ACT scores.
The ACT adds incremental value beyond GPA, and it tends to matter more in highly selective admissions, but it shouldn't carry more weight than a student's full academic record.
Score gaps across racial and income groups
Benchmark attainment isn't equal across student populations.
According to reporting from the Hechinger Report, Asian and white students far outperform African American, Latino, Pacific Islander, and American Indian students on ACT College Readiness Benchmarks.
ACT's own data show that African American benchmark attainment across all four subject areas remains significantly lower than national averages.
Students from lower-income families and households without a college-going tradition face compounding disadvantages, and meeting multiple benchmarks is rare in those groups.
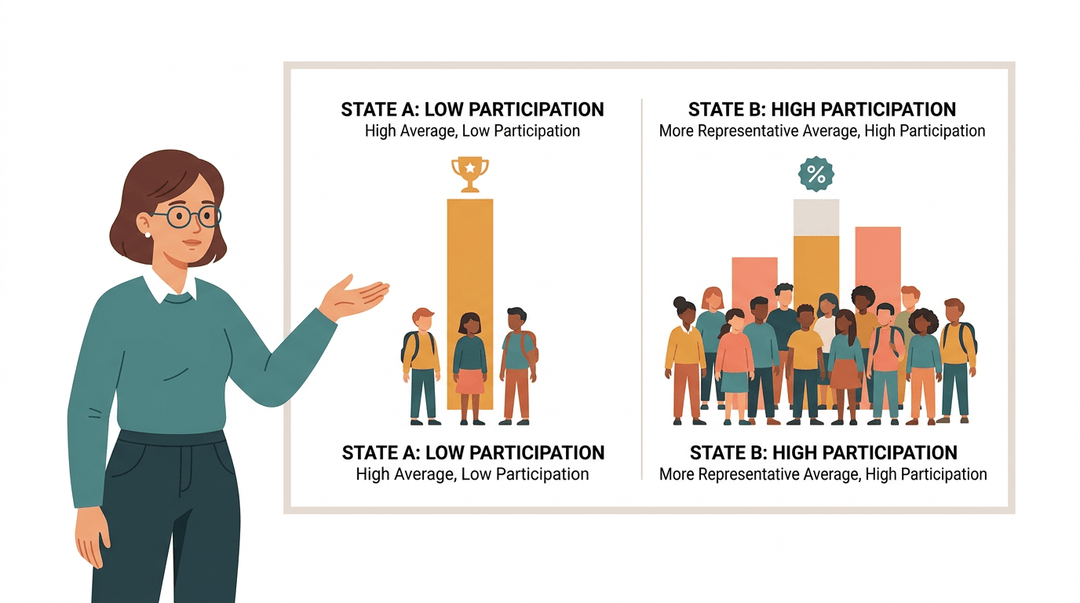
Why state averages vary so widely
NCES data show state average ACT scores ranging from 17.8 to 25.5, a gap that looks dramatic until you account for participation.
States where nearly every graduate takes the ACT pull in a broader, more representative student population, which lowers the average.
States with low participation rates tend to attract only college-bound, academically motivated students, which pushes averages up. When you're interpreting a state ranking with your students, that context matters.
ACT scores are a snapshot, not a verdict. When you understand the scale, the benchmarks, and the context behind each number, you can help students see their results clearly and plan their next move with confidence.
That's the real value here: not the score itself, but what you and your student do with it.
Ready to bring that same clarity to tracking progress in your classroom? Check out our post on Grading & Assessment to see how the right tools make interpreting student data a whole lot easier.
References
- Class of 2027 Profile — undergrad.admissions.columbia.edu
- CORRELATION BETWEEN ACT SCORES AND FINAL GPA — nwmissouri.edu
- What Are ACT's College Readiness Benchmarks? — senate.texas.gov
- Do I need a minimum required SAT or ACT score? — college.harvard.edu
- High school GPA, not ACT score, is a strong predictor of college graduation — consortium.uchicago.edu
- Average ACT scores and percentage of graduates taking the ACT ... — nces.ed.gov
- Understanding Your ACT Scores — act.org
- Most students aren't ready for college, ACT data show — hechingerreport.org
- African American Students — act.org
- Anticipated Changes In Act Scores And Participation Rates With Act ... — act.org
- Average ACT Test Score By State — igcsepro.org
Frequently asked questions
Is a 27 considered a good ACT score?
Yes, a 27 is considered a good ACT score for most schools. It places a student in a strong range for selective colleges, putting them above the majority of test-takers. While it may not be sufficient for top-tier universities, it is well above the national average and competitive for many four-year institutions.
Is 30 out of 36 a good ACT score?
Yes, a 30 out of 36 is an excellent ACT score. Scores of 30 and above are generally expected at top-tier universities due to the highly competitive applicant pools for these institutions. A 30 composite currently sits around the 94th percentile nationally.